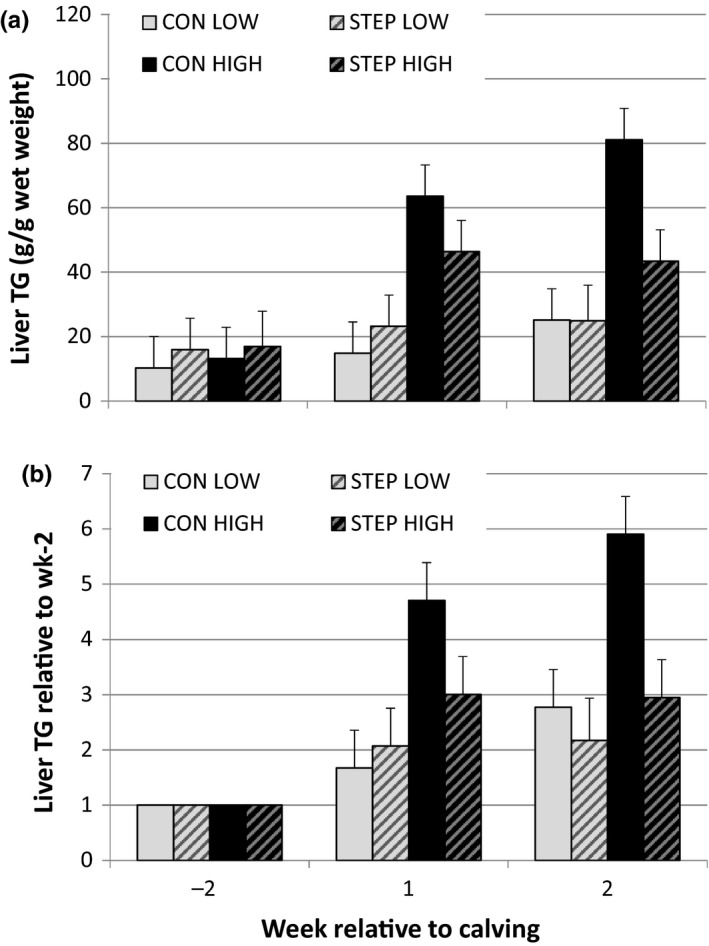
Figure 3.

Liver triglyceride (TG) concentration for the subset of 16 cows with liver biopsies taken at week −2, week 1 and week 2 relative to calving with (a) absolute TG concentration, in g/kg wet weight; and (b) TG concentration expressed relative to week −2. Figures showing predicted means by REML analysis with SEM
