
Figure 3.
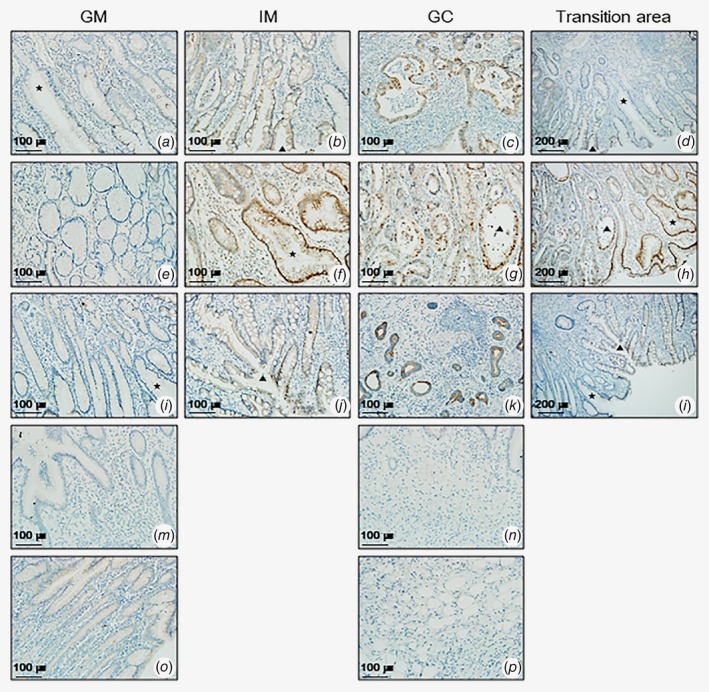
Immunohistochemical staining for OC2 in paired clinical tissues from five patients. OC2 was examined in formalin‐fixed, paraffin‐embedded sections from two types of GC using rabbit anti‐OC2. The top three rows (a–l) represent IGC tissues three patients, the bottom two rows (m–p) represent DGC tissues from two patients. Left three panels from each row show GM, IM and GC lesions and the far right panel show transition areas between GM and IM (d, a + b), between IM and GC (h, f + g), and between GM and IM (l, i + j). Filled star and triangle indicate same position between images of each lesion and transition area. The bottom two rows (m–p) represent DGC tissues showing only GM and GC lesions. All images were acquired at 100× or 200× magnification.