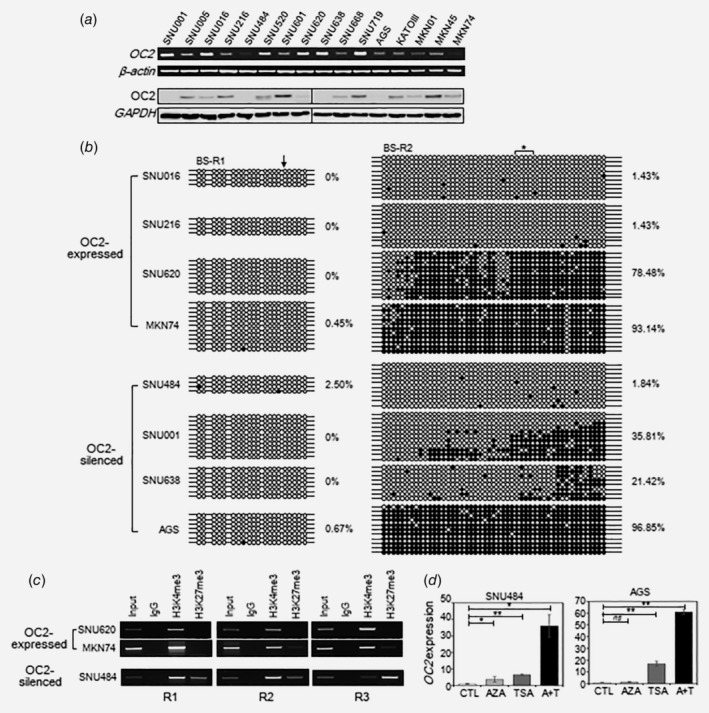
Figure 4.

OC2 Expression, bisulfite sequencing and ChIP‐PCR in GC cell lines. (a) RT‐PCR results for 16 GC cell lines. (b) Eight GC cell lines were categorized based on level of OC2 expression as assessed with RT‐PCR (4 Strong, 2 Weak and 2 Silenced). Bisulfite sequencing was performed as in Figure 1 e. (c) ChIP at the three regions in Figure 1 d for eight lines categorized as strong or weak/silenced. H3K4me3 and H3K27me3 were used as active and repressed markers, respectively. IgG was used as a negative control. (d) Restoration of OC2 mRNA level after treatment with 5‐aza‐dC (AZA) and/or trichostatin A (TSA). OC2 expression was examined by qRT‐PCR and normalized to β‐actin expression in each sample. Each value is the mean ± SD of three independent experiments. *p < 0.05, **p < 0.01 versus untreated (CTL) cells; ns: nonsignificant.
