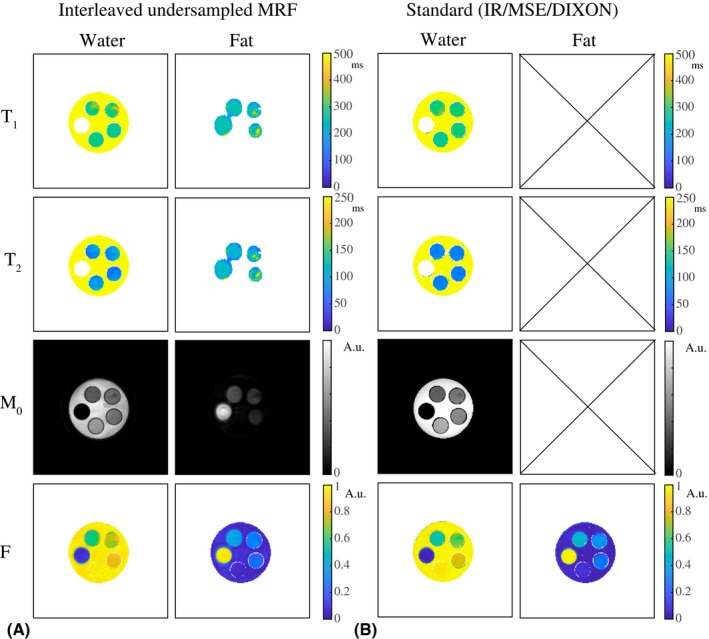
Figure 3.

Magnetic resonance fingerprinting and reference measurements in a phantom. A, T1, T2, and M0 maps obtained from an interleaved, undersampled (R = 20), spiral MRF acquisition. B, Water T1 and M0 maps obtained from a fat‐suppressed inversion recovery (IR), water T2 maps obtained from a multiple spin‐echo (MSE) sequence with a tri‐exponential fit, and a water and fat fraction (F) map obtained from DIXON (all Cartesian). The water T1 maps and the water and fat fraction maps obtained with MRF are close to that obtained with fat‐suppressed IR and DIXON. The water T2 maps obtained with the MSE sequence show shorter values compared with those obtained from the MRF measurements. The fat T1, T2, and M0 maps are not shown for the standard methods, as fat suppression was used in the acquisition (IR) or during data processing (MSE)
