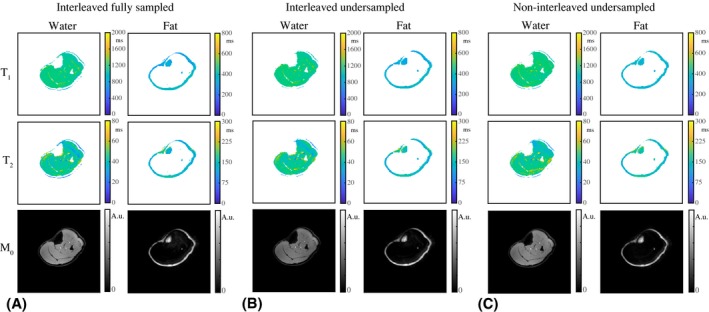
Figure 4.

Water–fat‐resolved parameter maps in a volunteer at rest. A, The T1, T2, and M0 maps in a fully sampled experiment are shown for the water and the fat part separately. Low‐signal regions after separation were masked out in the maps. B, The T1, T2, and M0 maps from an undersampled (R = 20) experiment are of very similar quality compared with those resulting from a fully sampled experiment. C, The parameter maps in (A) and (B) are both very similar to those obtained from an undersampled (R = 20) experiment, in which 2 separate scans were performed, each with a constant TE (2.3 and 3.45 ms). Note that results in (A)‐(C) are all obtained from separate scans, in which any type of motion may have had different effects
