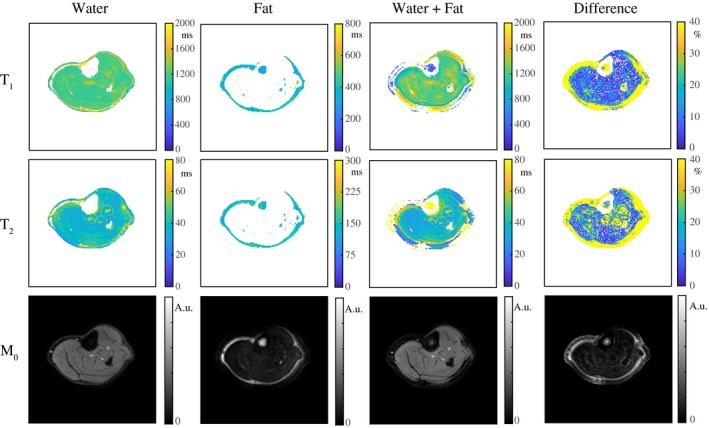
Figure 6.

Water‐fat resolved MRF parameter maps in a volunteer's calf. The T1, T2, and M0 maps in an undersampled (R = 20) experiment are shown with separation (water, fat) and without separation for the out‐of‐phase TE (water + fat) in a volunteer at rest. The percentage difference between the water maps and the water + fat maps for all volunteers indicate that by separating the fat signal from the water signal, the mean estimated T1/T2 values in a region of interest in the gastrocnemius medialis muscle are significantly increased/reduced by 105 ± 94/14 ± 6 ms, underlining that fat is a confounding factor in the quantification. Low‐signal regions were masked out in the T1 and T2 maps
