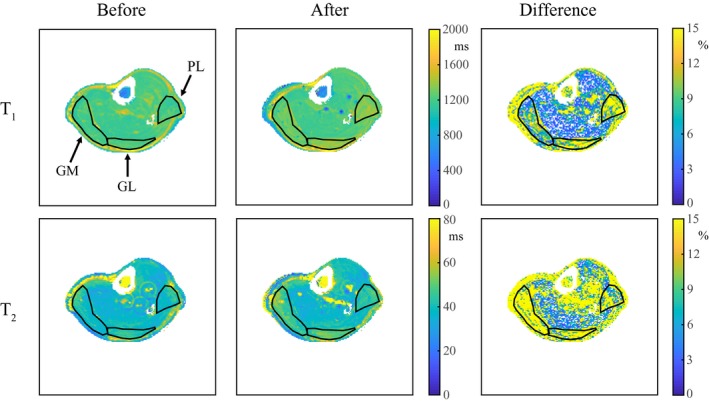
Figure 7.

Water T1 and T2 MRF maps in a volunteer's calf before and after exercise. The water T1 and the T2 maps show an increase of approximately 65 ms and 9 ms, respectively, directly after exercise. The percentage difference between the parameter maps before and after exercise (with respect to at rest) shows that this increase is most pronounced in the gastrocnemius medialis (GM), the gastrocnemius lateralis (GL), and the peroneus longus (PL), whereas water T1 and T2 values in other muscles are mostly unchanged. Circular flow artifacts are visible around the larger vessels
