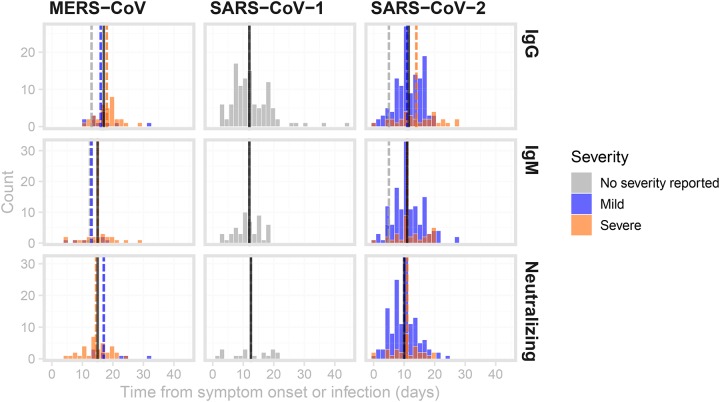
Figure 3: Distributions of times from symptom onset to detection of antibodies against MERS, SARS-CoV-1 and SARS-CoV-2.
Times between symptom onset and the detection of IgG (top row), IgM (middle row) and neutralizing antibodies (bottom row). Black vertical lines indicate the median values across all severity ratings, while dashed coloured lines are the median values for mild (blue), severe (orange) illnesses as well as illnesses of unreported severity (grey). Data were digitized from 12 studies23,27,29,30,32,34,40,44,135–138.
Distributions of times from symptom onset to detection of antibodies against MERS, SARS-CoV-1 and SARS-CoV-2.

