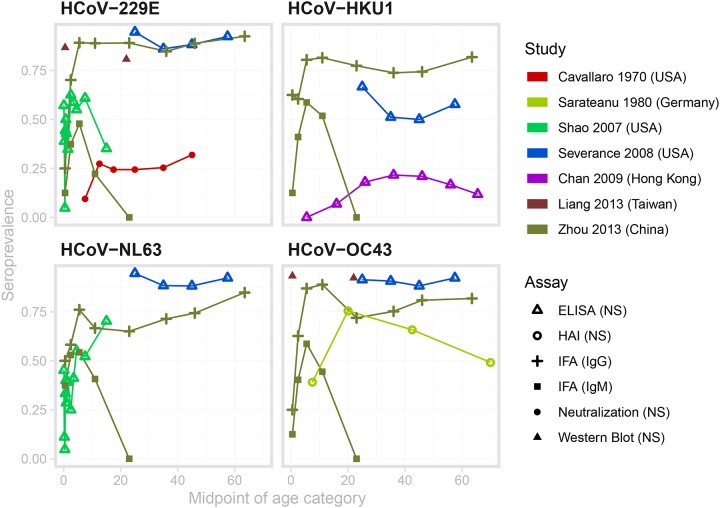
Figure 7: Age-seroprevalence curves for the studies with appropriate, digitizable data on endemic HCoV.
The color denotes the study, and the point type denotes the assay and antibody measured. Data from Sarateanu et al is averaged over two serosurveys conducted in 1975 and 1976. Data from Liang et al. were measured in cord blood samples and adults aged 18–25, and do not represent the change in seroprevalence across childhood. Therefore we have not connected these two points with a line.
Age-seroprevalence curves for the studies with appropriate, digitizable data on endemic HCoV.

