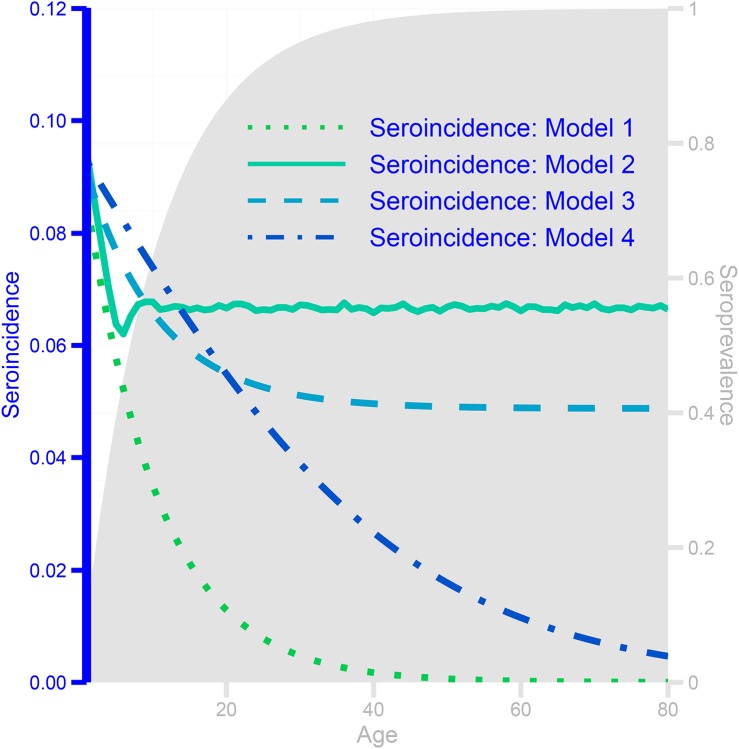
Figure 9: Seroprevalence (shaded area, scale indicated by right y-axis) and seroincidence (lines, scale indicated by left y-axis) curves by age for a single strain for four hypothetical models of coronavirus immunity:
complete homologous immunity (Model 1), complete homologous immunity for 5 years, then reversion to full susceptibility (Model 2), partial homologous immunity for life after the first infection (Model 3), and 4 genotypes within a strain, conferring lifelong genotypespecific immunity but no within-strain cross-immunity (Model 4).
Seroprevalence (shaded area, scale indicated by right y-axis) and seroincidence (lines, scale indicated by left y-axis) curves by age for a single strain for four hypothetical models of coronavirus immunity.

