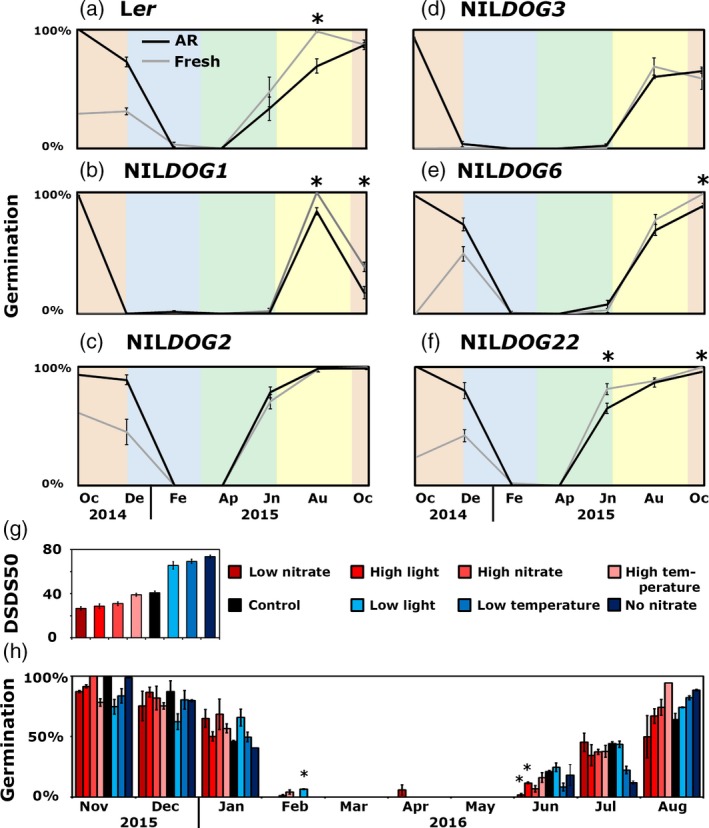
Figure 2.

Effect of primary seed dormancy levels on dormancy cycling.
(a–f) Germination percentage of fresh (grey) and after‐ripened (AR) seeds (black) after being exposed to field conditions from October 2014 until October 2015. Asterisks indicate significant differences between the fresh and AR seeds (P = 0.05, n = 4).
(g) Days of seed dry storage to reach 50% of germination (DSDS50) of the seeds when grown under different maternal environments.
(h) The germination percentages of seeds grown under different maternal environments (colour coded as in g) during burial. Asterisks indicate significant differences by Student’s t‐test (P = 0.05, n = 2, except the August high‐temperature sample, n = 1).
