
Figure 5.
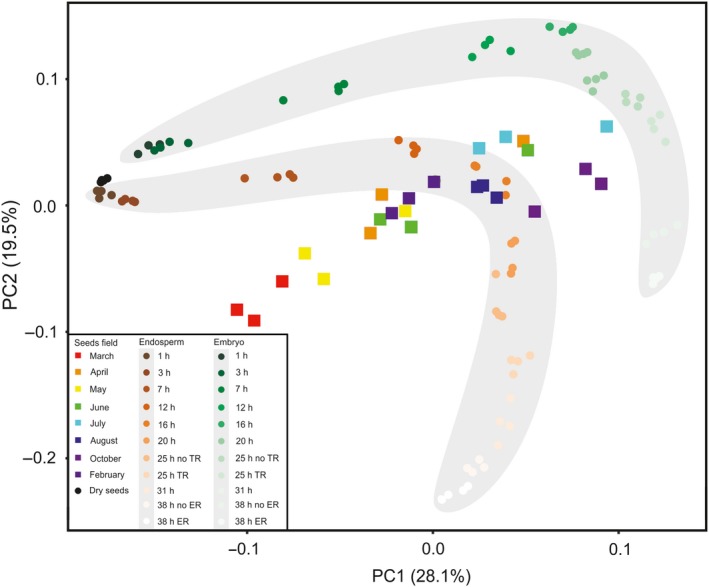
Principal component (PC) analysis of transcriptional changes in seeds that cycle through dormancy compared with those in non‐dormant imbibed seeds.
The first two principal components, explaining 28.1 and 19.5% of the variation, respectively, are presented. Square symbols indicate individual samples from the field experiments. Circles indicate individual samples from the Dekkers et al. (2013) data set. The grey shaded area containing the brown circles highlights all radicle samples; the grey shaded area containing the green circles highlights all micropylar endosperm samples. The four different quadrants represent clustered samples during early imbibition (top left), late imbibition (top right), germination (bottom right) and secondary dormancy (bottom left).