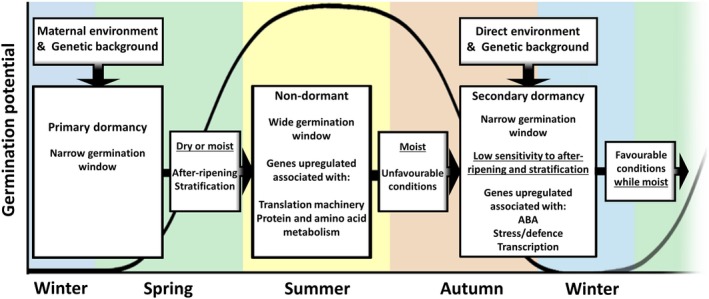
Figure 6.

Schematic representation of transcriptomic changes during dormancy cycling.
The black line indicates the germination potential during dormancy cycling. In nature, seeds can go through multiple dormancy cycles until they either germinate or lose viability. The gene ontology (GO) enrichment of the upregulated genes for the non‐dormant and dormant stages are derived from the up–down and down–up dominant patterns, respectively. Differentially upregulated genes used for the GO analyses are derived from the pairwise comparison. Full data are given in Appendix S1.
