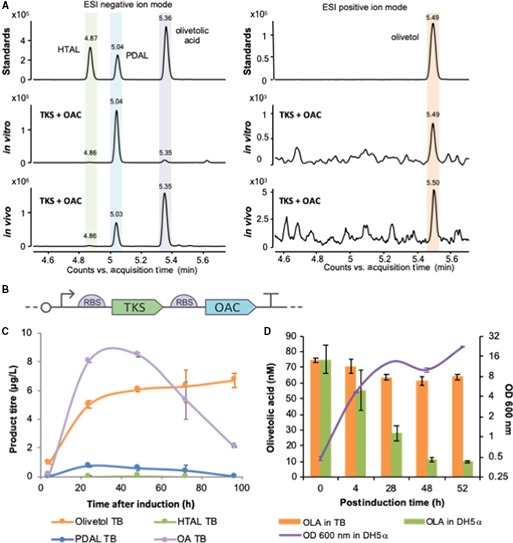
Figure 1.

Production profiling of TKS and OAC under in vitro and in vivo conditions. (A) LC Q‐TOF MS qualitative analysis of the products obtained by TKS expressed together with OAC in vitro and in vivo. Standards: commercial chemical standards. In vitro: products obtained in a biotransformation assay with purified TKS and OAC supplied with substrates. In vivo: products obtained when expressing TKS and OAC in Escherichia coli as shown in (B) at 20 °C after induction in TB media. Negative controls for both conditions are shown in Fig. S1. Samples were run in ESI negative ion mode. The chromatogram shown is composed by two merged extracted ion chromatograms (m/z = 223.098 and 181.087), and the single chromatograms are shown in Fig. S1. Samples run in ESI positive ion mode, and chromatogram shown is extracted ion chromatogram (m/z = 181.12). The retention times of authentic standards are HTAL (4.8 min), PDAL (5.03 min), olivetolic acid (5.3 min) and olivetol (5.59 min). (B) Schematic figure of the expression construct. (C) Quantification of olivetolic acid and by‐products with time obtained under in vivo conditions. Samples from E. coli transformed with construct (B) were collected at different time points after induction, grown at 20 °C in TB media. The compounds were quantified by LC combined with triple quadrupole MS (LC‐MS/MS) using reference standards at known concentrations (see Material and Methods). Data points are average of two biological replicates, and bars represent standard deviation. (D) Olivetolic acid degradation in the presence of E. coli. Cultures of a GFP‐expressing plasmid (pBbB2c‐GFP) 16 in TB medium (5 mL; starting OD600 nm of 0.1) were incubated at 37 °C until the OD600 nm reached 0.8. Olivetolic acid (100 μm) was added to this culture followed by a further incubation at 30 °C for 52 h at 200 r.p.m. Control incubations of olivetolic acid were performed in TB medium only with no E. coli present. Periodic culture sampling was performed, and OD600 nm was measured as well as olivetolic acid extracted in ethyl acetate, dried, resuspended in methanol and analysed by LC/MS. Data points are the average of three replicates, and bars represent standard deviation. OLA in TB: media only with the addition of olivetolic acid standard; OLA in DH5α: E. coli strain DH5α with the addition of olivetolic acid standard. OD600 nm DH5a: Growth of E. coli strain DH5α.
