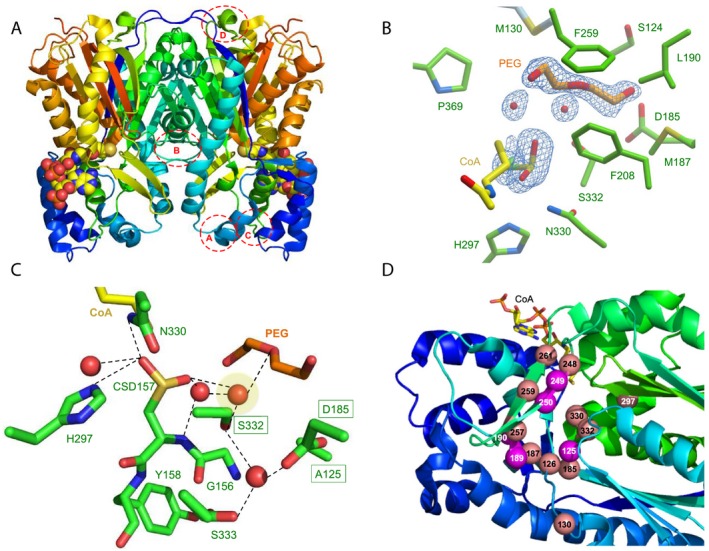
Figure 4.

Crystal structure of TKS from Cannabis sativa. (A) Overall dimeric structure of TKS shown as a cartoon with CoA as atom coloured spheres. Dashed circles show the regions of deviation from the structure of STS. Regions: A = L65‐Q82; B = S124‐A133; C = R192‐L202 and D = D222‐I230. (B) Active site of TKS, showing density corresponding to oxidized C157, water molecules and polyethylene glycol (PEG). The corresponding omit electron density is shown contoured at 1σ as a blue mesh for the bound PEG ligand, associated waters and the oxidized C157. (C) Hydrogen‐bonding network of active site waters. Residues and ligands are shown as atom coloured sticks with green and orange/yellow carbons, respectively. The catalytic water is highlighted in yellow, and the three equivalent residues in STS important for the aldol switch are boxed. (D) Location of the residues targeted for mutagenesis in TKS. Spheres in salmon were all mutated to alanine (S126, M130, D185, M187, I248, H297, N330, S332, L257, F259 and L261), while magenta residues underwent site‐specific mutagenesis (A125T, C189V, L190T, G249D, G250A). CoA is shown as atom coloured sticks with yellow carbons.
