Figure 1.

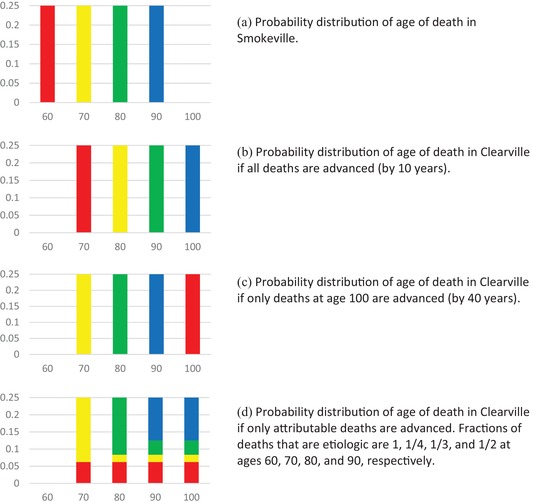
Probability distribution of age of death showing alternative possible fractions of deaths advanced by age. Colors correspond to age at which individual would die in Smokeville.

Probability distribution of age of death showing alternative possible fractions of deaths advanced by age. Colors correspond to age at which individual would die in Smokeville.