
Figure 1.
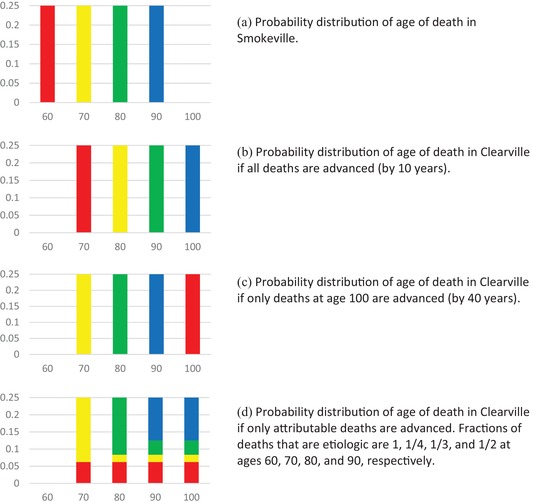
Probability distribution of age of death showing alternative possible fractions of deaths advanced by age. Colors correspond to age at which individual would die in Smokeville.
Official websites use .gov
A
.gov website belongs to an official
government organization in the United States.
Secure .gov websites use HTTPS
A lock (
) or https:// means you've safely
connected to the .gov website. Share sensitive
information only on official, secure websites.
Probability distribution of age of death showing alternative possible fractions of deaths advanced by age. Colors correspond to age at which individual would die in Smokeville.