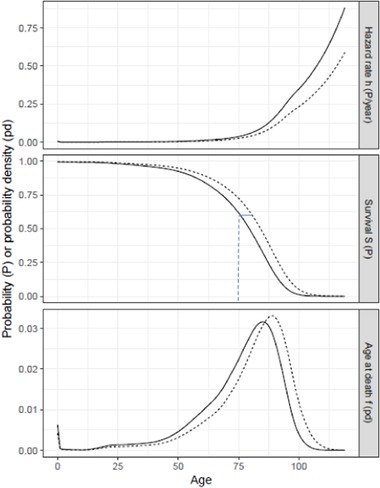
Figure 2.

Annual hazard, survival, and marginal distribution of deaths by age. Exposed (h 1, solid curves) are for US males (2014 period lifetable http://www.ssa.gov/oact/STATS/table4c6.html). Unexposed (h 0, dashed curves) are for annual hazard = (2/3) annual hazard if exposed. The short horizontal line segment in the middle panel is the years of life lost by individuals dying at age 75 when all deaths are etiologic, that is, S 0 −1[S 1(75)] – 75 in expression (7).
