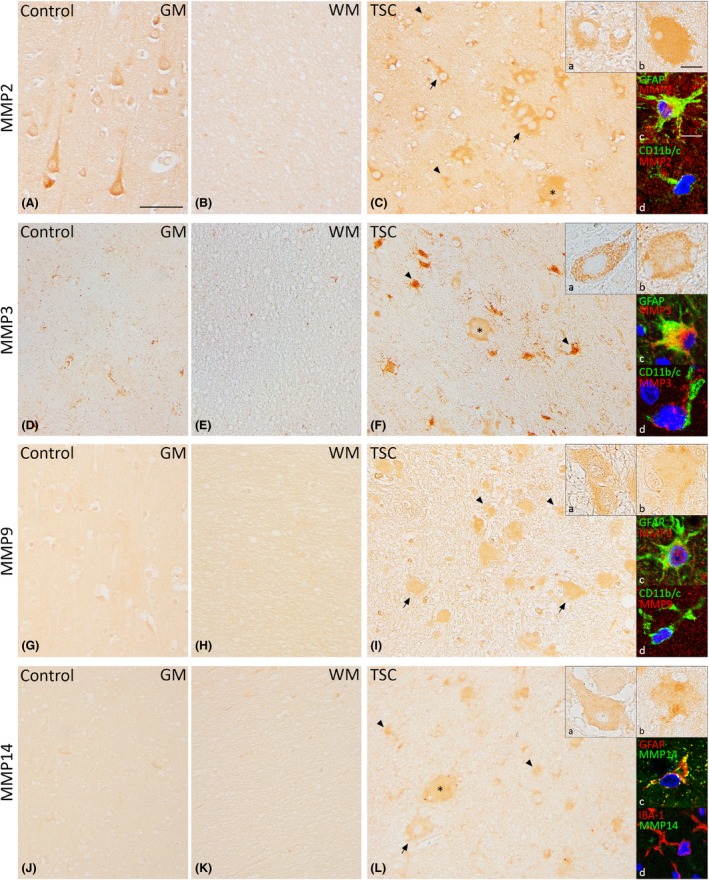
Figure 2.

Expression of matrix metalloproteinases 2 (MMP2), MMP3, MMP9 and MMP14 in TSC tubers. Strong MMP2 expression in neurons and weak MMP2 expression in glial cells were seen in control cortex (A,B). In TSC tubers, strong MMP2 expression was observed in dysmorphic neurons, giant cells and glial cells. (C). MMP3 expression was not observed in neurons and weakly in glial cells of controls (D,E). Moderate expression was observed in dysmorphic neurons and giant cells, while expression was strong in glial cells (F). Moderate MMP9 expression was observed in neurons and no to weak expression was seen in glial cells of control cortex (G,H). In TSC tubers, dysmorphic neurons, giant cells and astrocytes showed moderate MMP9 expression (I). MMP14 expression was weak in neurons and not present in glial cells in controls (J,K). Moderate expression of MMP14 was observed in dysmorphic neurons, giant cells and astrocytes of TSC tubers (L). Insets a show magnification of dysmorphic cells, insets b show magnification of giant cells. Insets c and d in C,F,I and L depict double‐labelling of MMPs with glial fibrillary acidic protein (GFAP)‐positive cells (astrocytes) and IBA‐1 or CD11b/c‐positive cells (microglia), counterstained with 4′,6‐diamidino‐2‐phenylindole (DAPI, blue). GM, grey matter; WM, white matter; TSC, tuberous sclerosis complex. Arrows depict dysmorphic neurons, arrowheads depict glial cells and asterisks depict giant cells. Scale bar A–I: 100 μm; insets a, b: 25 μm; insets c, d: 12.5 μm.
