
Figure 3.
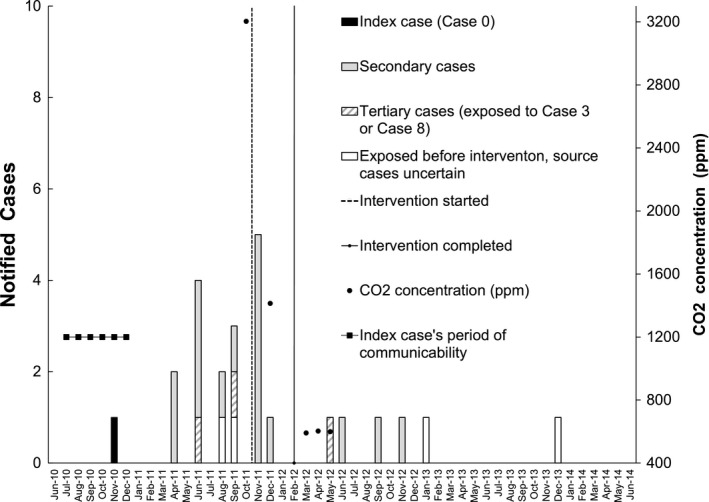
Epidemic curve by notification date of active tuberculosis (TB) cases and carbon dioxide (CO2) concentration (the monthly maximum values of daily average) in the underground floors of Building C before and after ventilation engineering intervention. Index case (black), secondary cases (gray), and tertiary cases (diagonal) are shown by different color or pattern. Four additional cases caused by the same strain (white) were found by cross‐checking 20 392 employees and students who had stayed at University A campus before the ventilation engineering was completed on January 16, 2012: Case 9 was exposed to Case 0 in the CB2 classroom for only 20 h, but exposed to Case 3 in Building M on the same floor (but not in the same room) for 62 h; Case 22 exposed to Case 0 for 32 h, to Case 3 for 39 h, to Case 8 for 14 h, and Case 23 was exposed to Case 0 for 30 h, Case 3 for 39 h, Case 8 for 14 h, Case 9 for 8 h, all in Building M on the same floor but not in the same room. The curriculum of Case 7 could not be matched to any TB cases. The final four cases (one notified in 2016, 2017, and two in 2018, respectively, not shown in the Figure) were contacts of the index case (contact occurred in poorly ventilated environments before the ventilation engineering). All these four patients had been diagnosed to have latent TB infection in late 2011 but refused to receive isoniazid preventive therapy