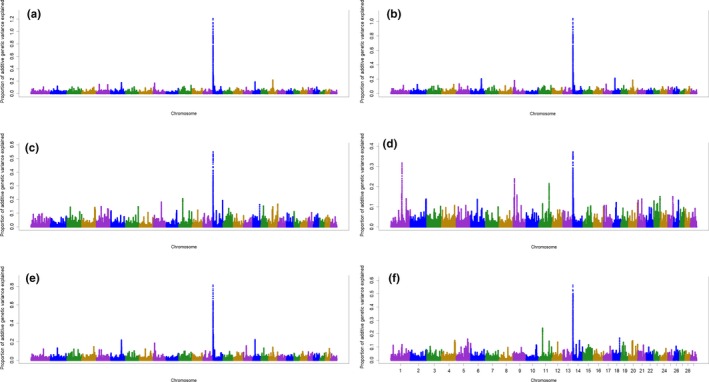
Figure 1.

Additive genetic variance explained by windows of 50 adjacent SNP across chromosomes for 305‐day milk yield (a), peak yield (b), peak time (c), ramp (d), scale (e) and decay (f) in primiparous cows [Colour figure can be viewed at http://www.wileyonlinelibrary.com]
