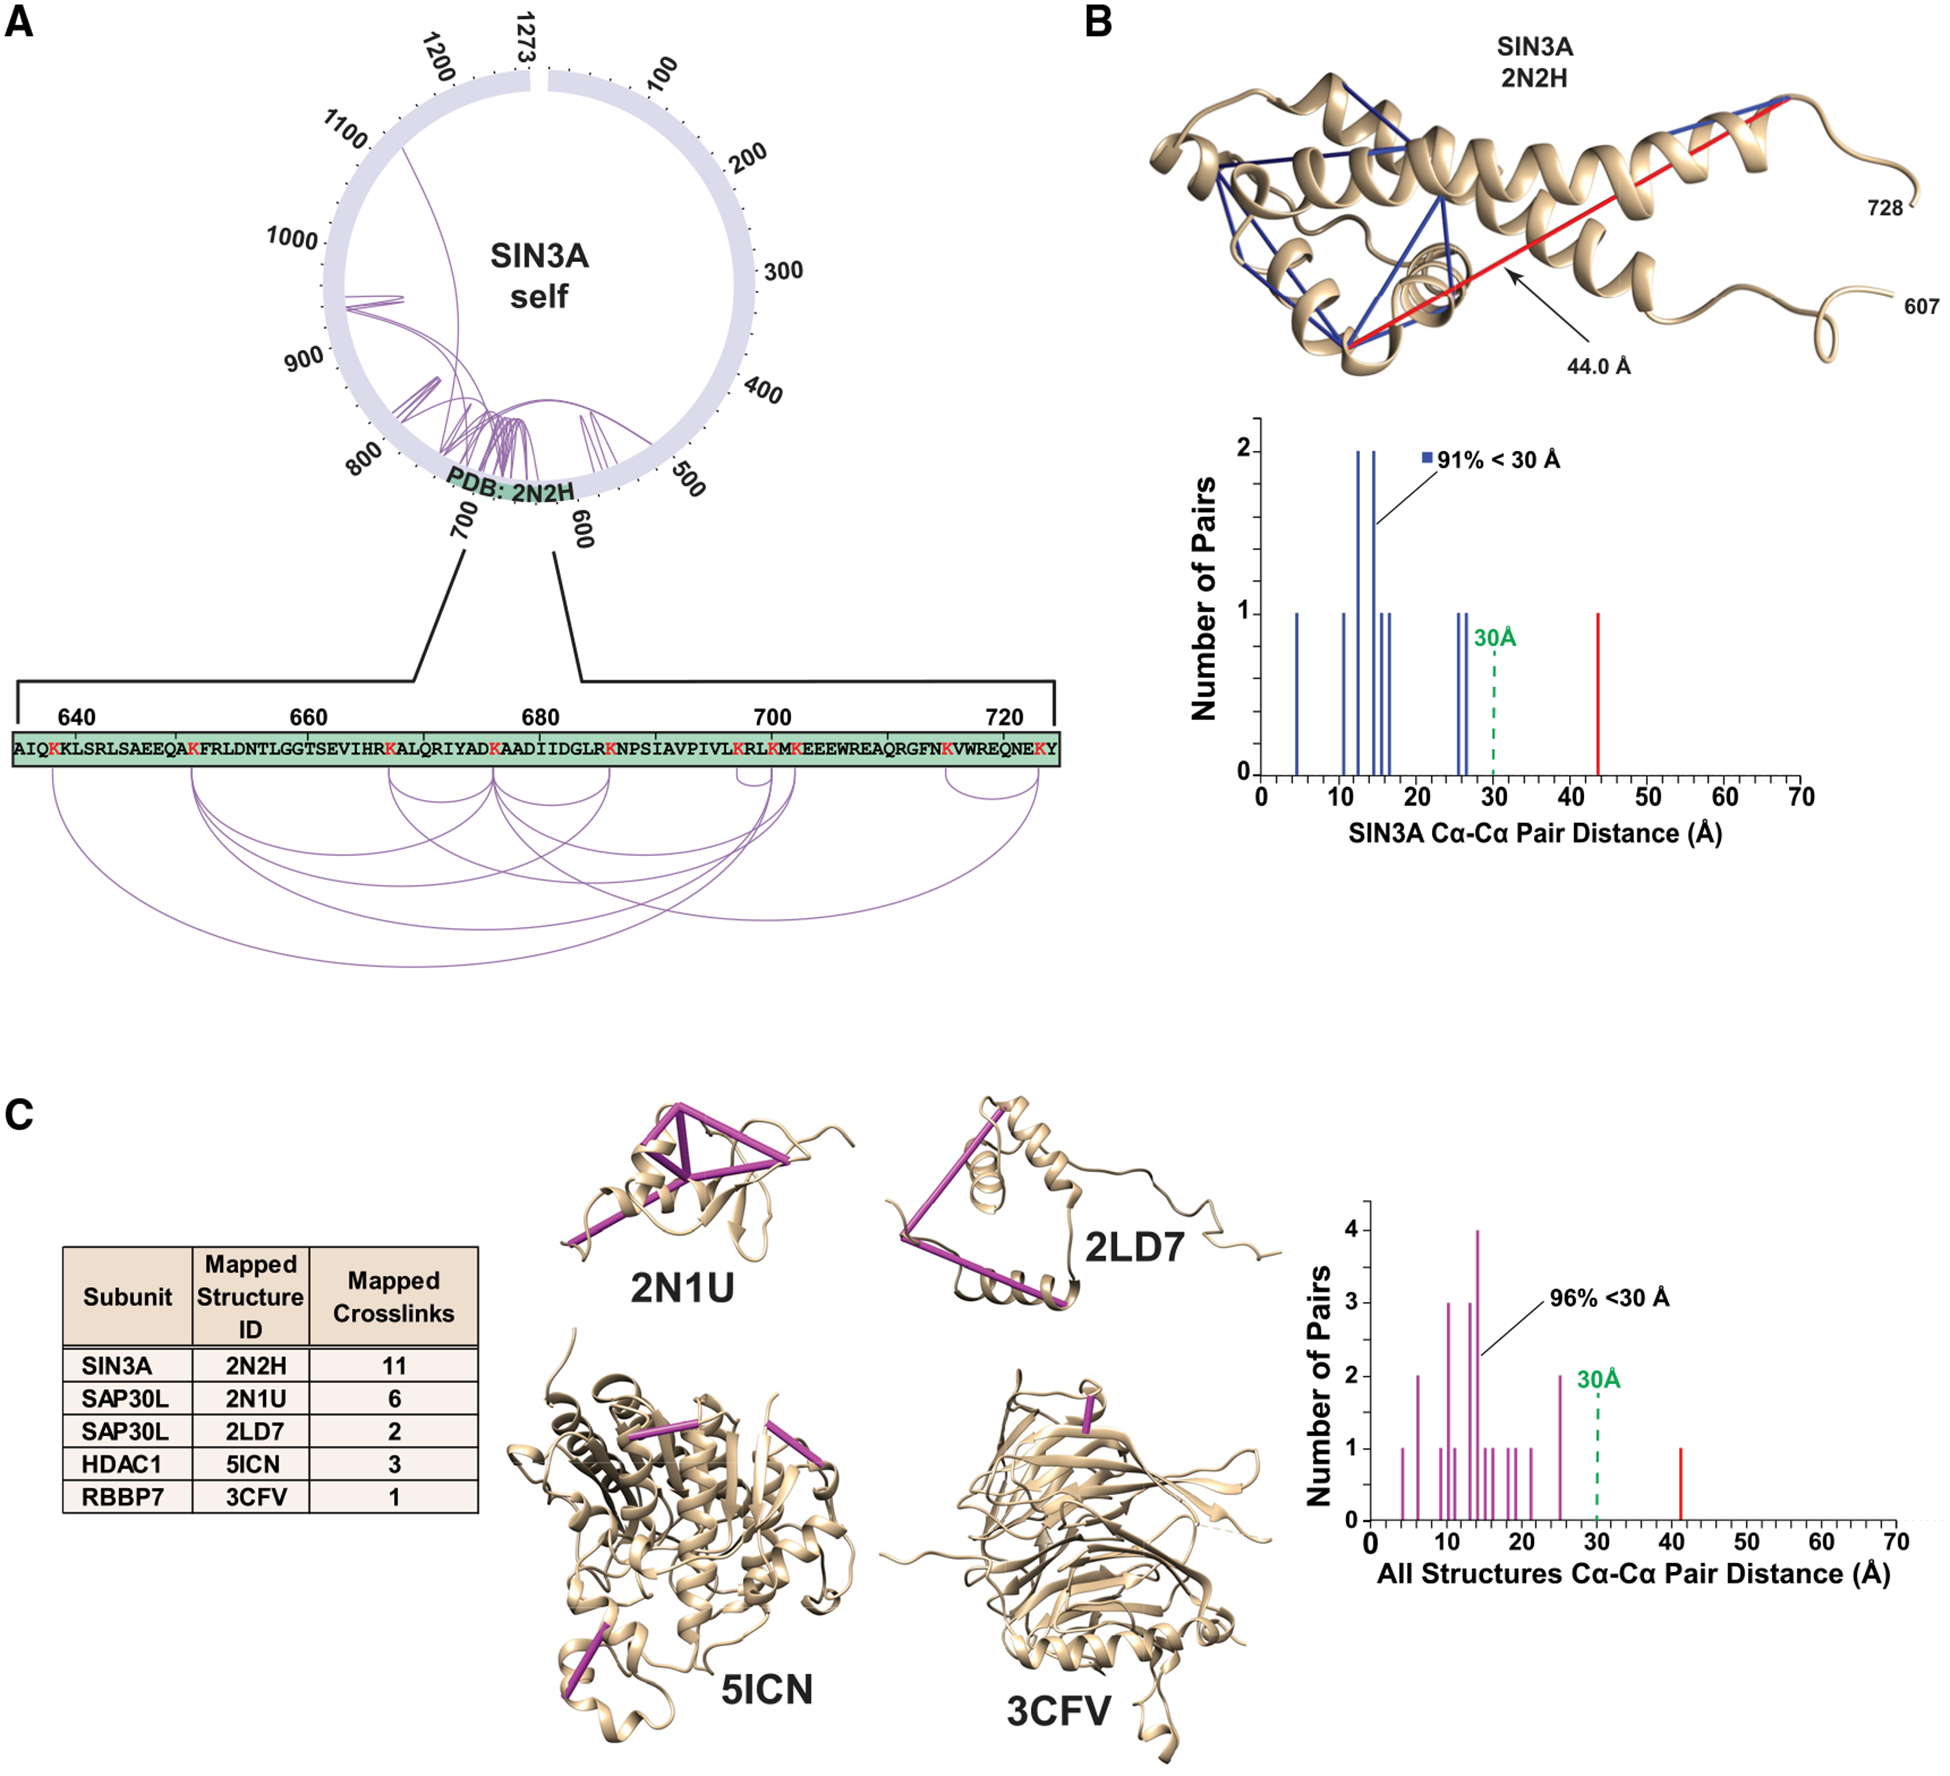
Figure 2. Cα-Cα Distance Distributions for Crosslinks Mapping to Sin3 Subunit Structures.

(A) PDB: 2N2H (Clark et al., 2015a) maps to a SIN3A region containing 11 self crosslinks.
(B) Distribution of Cα-Cα crosslink distances mapping to PDB: 2N2H (distances <30-Å,blue bars; distance >30Å, red bar).
(C) All regions of Sin3 subunits with both structural data and self-crosslinks.
