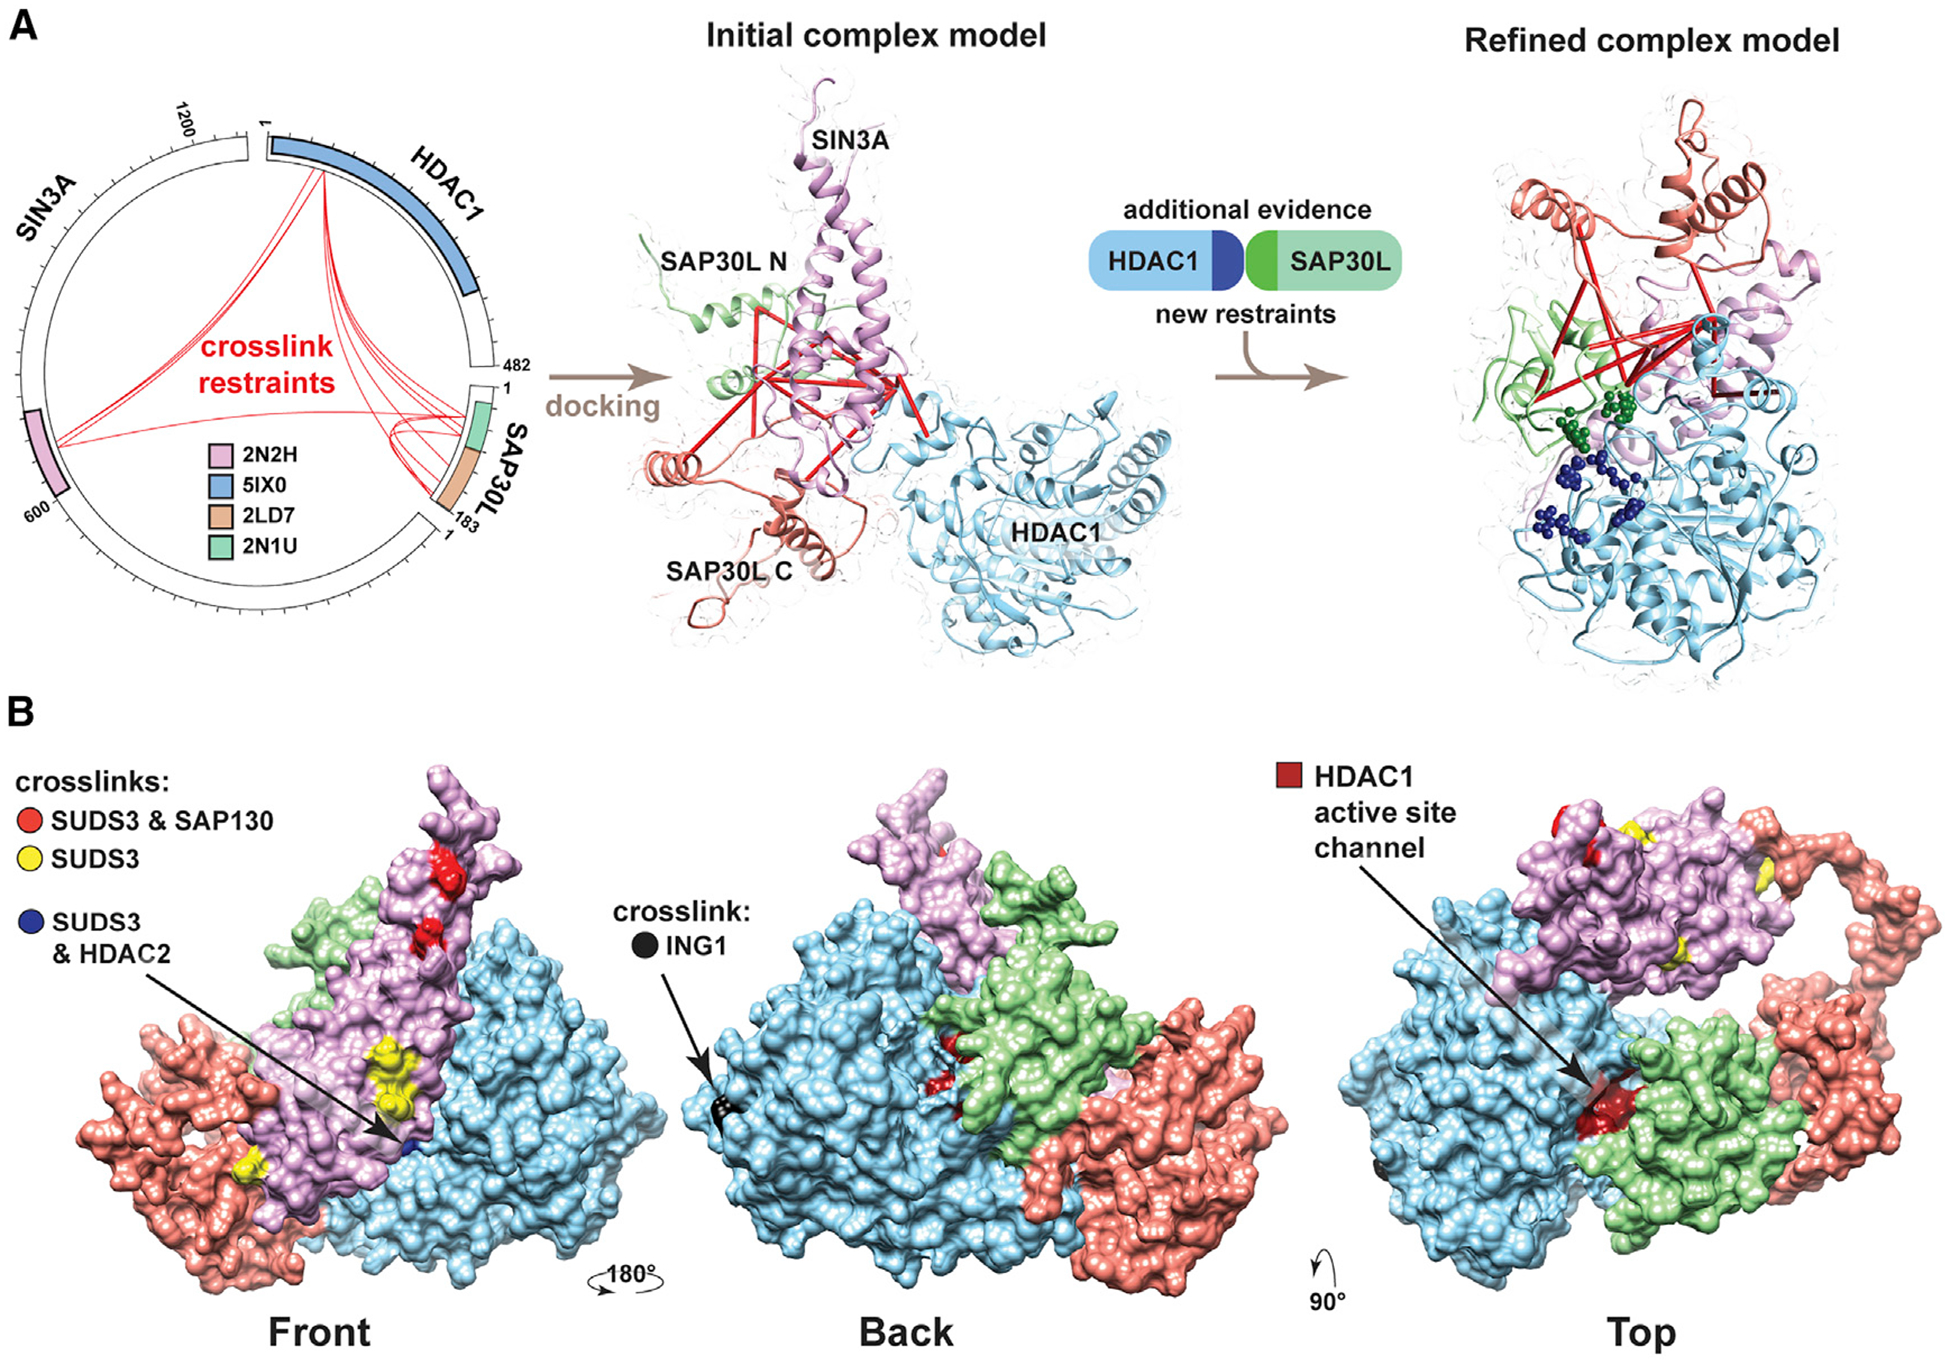
Figure 4. Architecture of the SIN3A/SAP30L/HDAC1 Complex.

(A) Sin3 structures modeled using SWISS-Model (based on indicated PDB structures) were docked using HADDOCK (de Vries et al., 2010) guided by docking restraints from the indicated crosslinks (red lines) to generate an initial complex model. Additional evidence supporting an interaction between SAP30 and HDAC1 (Marcum and Radhakrishnan, 2019) was then used with the crosslinking restraints to generate a second refined-complex model.
(B) Refined model of the SAP30L/SIN3A/HDAC1 sub-structure, showing the SIN3A residues crosslinked to SUDS3 (yellow), to both SUDS3 and SAP130 (red), and to both SUDS3 and HDAC2 (blue) or showing the HDAC1 residue crosslinked to ING1 (black). The position of the HDAC1 active site channel is also shown in dark red (Video S1).
