
Fig. 3 |. Nucleus-first cell polarity facilitates migration along the path of least resistance.
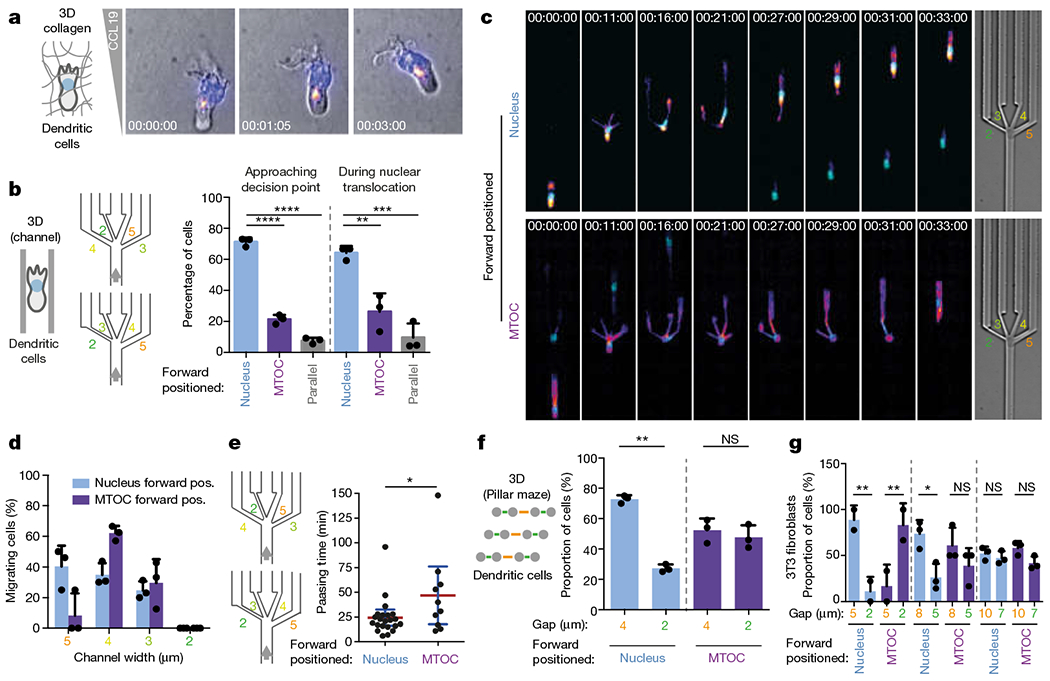
a, Position of MTOC (indicated by EMTB–mCherry, with fire colour-coded intensity: black (minimum), magenta, orange, yellow to white (maximum)) and nucleus (Hoechst stain; cyan) in a DC migrating in a collagen matrix along a CCL19 gradient (time indicated; representative of three experiments). b, Quantification of relative position of nucleus and MTOC in DCs before and during pore-size decisions (three experiments, 76 cells; one-way ANOVA with Tukey’s test; ****P < 0.0001, ***P = 0.0007, **P = 0.0049). c, Examples of DCs migrating through the decision point with the nucleus (top) or the MTOC (bottom) first (time indicated; representative of three experiments). d, Pore-size preference of DCs approaching a pore-size decision with nucleus or MTOC first (3 experiments, 76 cells). e, Time taken for cell to pass through a pore (passing time), based on whether the cell passes through in nucleus-first or MTOC-first configuration (three experiments, 32 cells; unpaired t-test; *P = 0.0389). f, Pore-size preference of DCs (nucleus-first versus MTOC-first configuration) migrating through pillar arrays with different pore sizes (three experiments, 31 cells, 252 pore passages; paired t-test; **P = 0.0042). g, Pore-size preference of fibroblasts (nucleus-first versus MTOC-first configuration) migrating through pillar arrays with different pore sizes (125 cells, 146 pore passages; one-way ANOVA with Tukey’s test; ***P = 0.0017, **P = 0.0088, *P = 0.0307). Data in b, d, f and g are mean ± s.d.; data in e are mean ± 95% confidence interval (CI).