
Extended Data Fig. 3 |. Migration of T cells, LMR7.5 cells and neutrophils through defined inhomogeneous spaces.
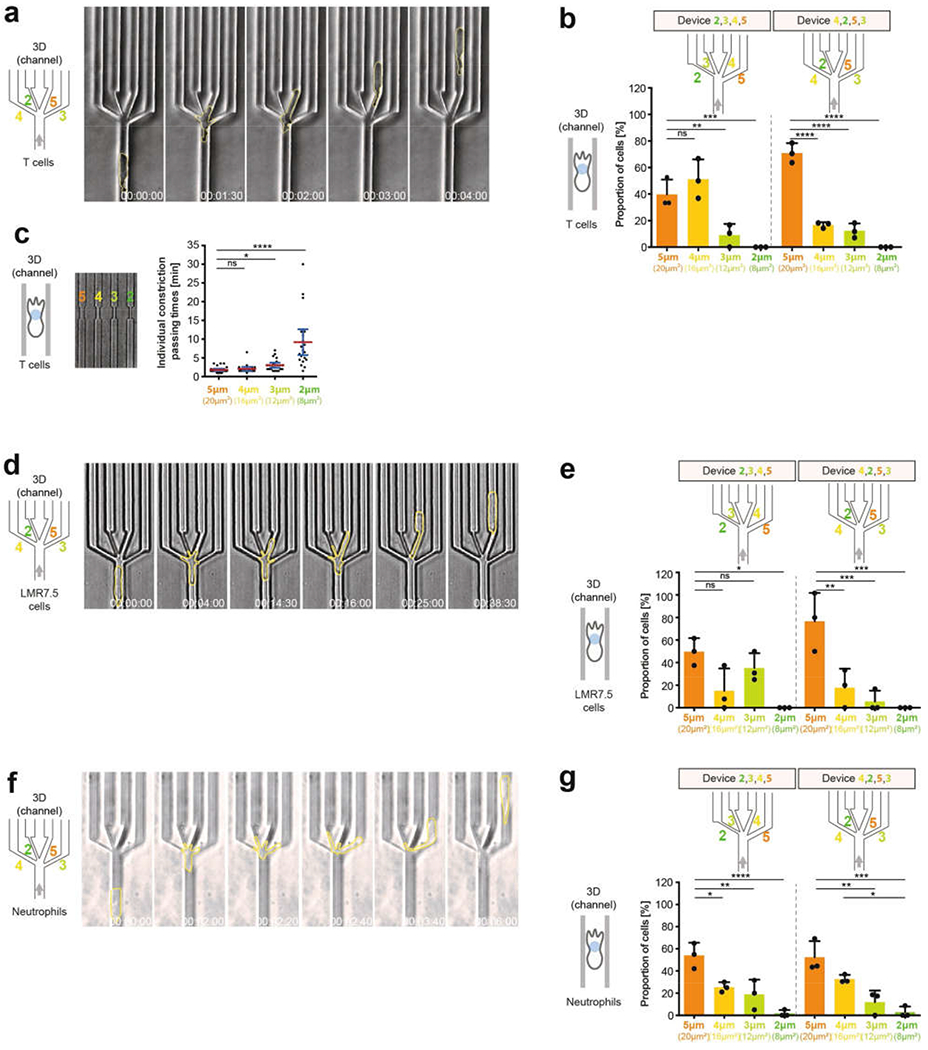
a, Image sequence of a representative T cell (cell outlines in yellow) migrating in microchannels through a junction (decision point) with pores 2, 3,4 and 5 μm wide (3 experiments). b, As in Fig. 1h, but showing the results of the pore-size preference of T cells in individual devices with different sequences of pore sizes (3 experiments, 37 (left) or 42 (right) cells; one-way ANOVA with Tukey’s test; ****P < 0.0001, ***P = 0.0003, **P = 0.0045). c, Passing times for T cells through the same pore sizes as in Fig. 1h, but without the possibility of pore choice (single pores; 3 experiments, 90 cells; Kruskal–Wallis with Dunn’s test; ****P < 0.0001, *P = 0.0128). d, Image sequence of a representative LMR7.5 T cell hybridoma cell (cell outlines in yellow) migrating in microchannels through a decision point with exits 2, 3, 4 and 5 μm wide (3 experiments). e, As in Fig. 1h, but showing the results of the pore-size preference of LMR7.5 T cell hybridoma cells in individual devices with different sequences of pore sizes (3 experiments, 23 (left) or 17 (right) cells; one-way ANOVA with Tukey’s test; ***P = 0.0002, ***P = 0.0004, **P = 0.0030, *P = 0.0132 (left to right), respectively). f, Image sequence of a representative neutrophil (cell outlines in yellow) migrating in microchannels through a decision point with pores 2, 3, 4 and 5 μm wide (height 2 μm) (3 experiments). g, As in Fig. 1h, but showing the results of the pore-size preference for neutrophils in individual devices with different sequences of pore sizes (3 experiments, 59 (left) or 63 (right) cells; one-way ANOVA with Tukey’s test; left: ****P < 0.0001, **P = 0.0054, *P = 0.0284; right: ***P = 0.0002, **P = 0.0014, *P = 0.0212). Data in b, e and g are mean ± s.d.; data in c are mean ± 95% CI.