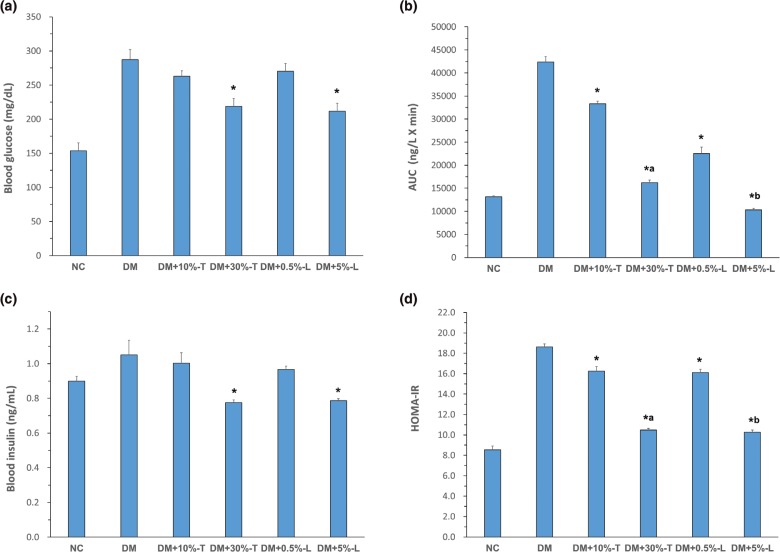
Fig. 1.
Blood glucose and insulin index analysis in various groups. (a) Fasting blood glucose concentration. (b) Glucose area under the curve (AUC 0–120 min). (c) Blood insulin level. (d) The homeostatic model assessment-insulin resistance (HOMA-IR) in various groups after 8 weeks of the white sweet potato intervention. Asterisks indicate significance level compared to DM group. Letter ‘a’ indicates significance level to DM + 10%-T group. Letter ‘b’ indicates significance level to DM + 0.5%-L group. All values are presented as means ± standard deviation (n = 5). Statistical evaluation was performed using one-way ANOVA, followed by Duncan’s multiple range test, P < 0.05.

