Figure 3.

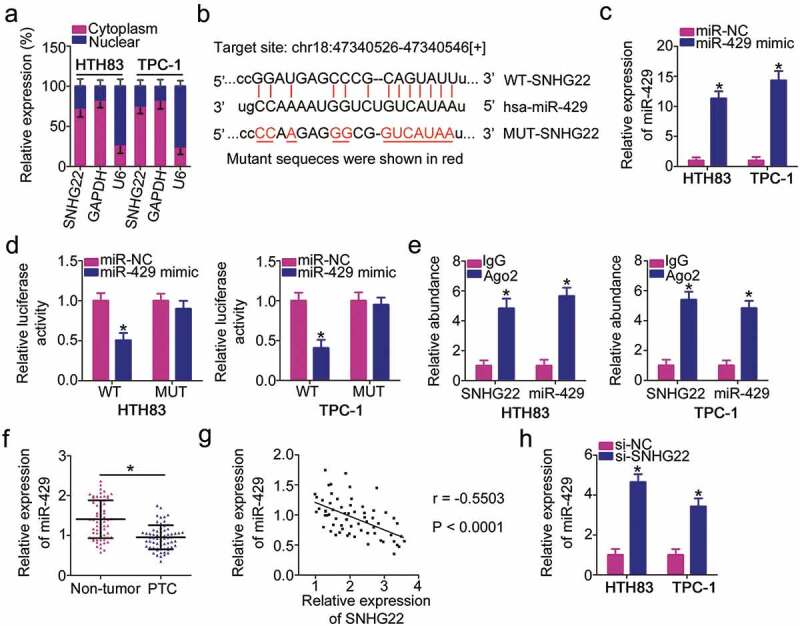
SNHG22 directly interacts with miR-429 in PTC cells as a miRNA sponge.
(a) The location of SNHG22 in HTH83 and TPC-1 cells was examined via the isolation of nuclear and cytoplasmic fractions and RT–qPCR analysis. RT-qPCR analysis was repeated at least thrice. (b) Diagram of the wild-type and mutant miR-429 binding sites on SNHG22. The miRNAs that can interact with SNHG22 were predicted by starBase 3.0 and LncBase Experimental v.2. The mutant sequences were shown in red. (c) miR-429 upregulation in HTH83 and TPC-1 cells driven by miR-429 mimic was confirmed using RT–qPCR analysis. RT-qPCR analysis was repeated at least thrice. *P < 0.05 vs. miR-NC. (d) Relative luciferase activity of WT-SNHG22 or MUT-SNHG22 reporter plasmids measured in presence of miR-429 mimic or miR-NC co-transfection. Luciferase reporter assay was repeated at least thrice. * P < 0.05 vs. miR-NC. (e) A RIP assay was conducted to test the enrichment of SNHG22 and miR-429 in Ago2 immunoprecipitate and IgG-pellet. RIP assay was repeated at least thrice.* P < 0.05 vs. IgG. (f) miR-429 expression was determined using RT–qPCR in 65 pairs of PTC tissues and paired adjacent non-tumor tissues. RT-qPCR analysis was repeated at least thrice. * P < 0.05 vs. paired adjacent non-tumor tissues. (g) Spearman’s correlation analysis was used to verify the inverse relationship between SNHG22 and miR-429 in PTC tissues. r = −0.5503, P < 0.0001. (h) miR-429 expression in HTH83 and TPC-1 cells upon SNHG22 knockdown was measured using RT–qPCR. RT-qPCR analysis was repeated at least thrice. *P < 0.05 vs. si-NC.
