
Figure 7.
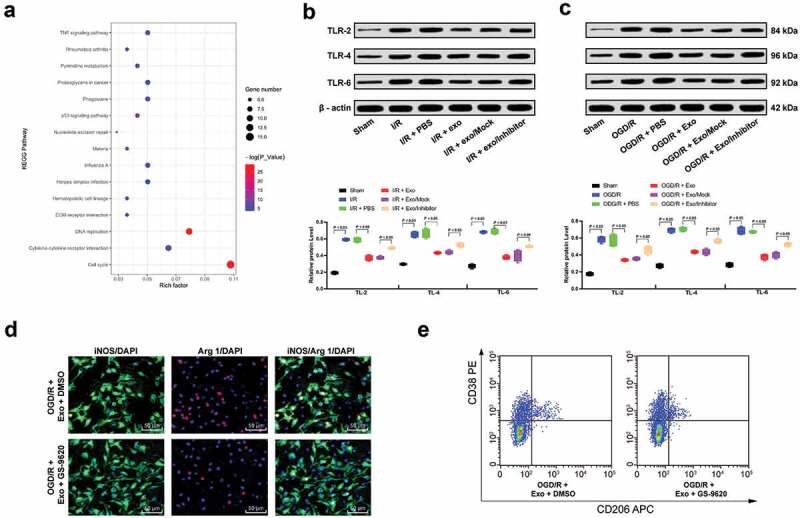
hUCMSCs-exosomal miR-26b-5p targets CH25H and inhibits the TLR pathways. (a), Clustering analysis was performed using the limma Rstudio based on GSE77986 using |logFC| > 2 and p < 0.05 for KEGG pathway between sham or I/R mouse microglia; Western blot analysis was performed to validate the TLR signal pathway activation both in mice (b) and isolated microglia (c). Then, TLR signaling pathway-specific activator GS-9620 was added into OGD/R- and exosomes-treated microglia; (d), Immunofluorescence staining of M1 phenotype microglia marker iNOS and M2 phenotype microglia marker Arg 1; E, CD38+CD206− was categorized as M1 phenotype microglia while CD38−CD206+ was M2 phenotype microglia detected by flow cytometry. Data are expressed as mean ± standard deviation; data in panels B and C were analyzed with one-way ANOVA, followed by Tukey’s multiple comparisons test. *p < 0.05. Three independent experiments were performed.