Figure 1.
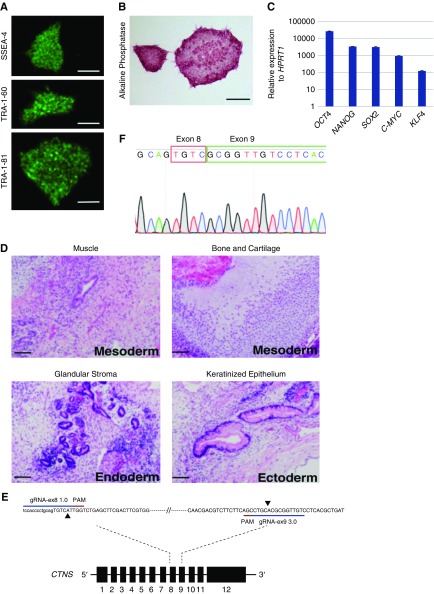
Patient-derived CTNS iPSCs display markers of pluripotency. (A) CTNS−/− iPSCs stained for stem cell surface antigens SSEA-4, TRA-1-60, and TRA-1-81. Scale bar, 500 µm. (B) CTNS−/− iPSCs stained for alkaline phosphatase. Scale bar, 500 µm. (C) qPCR of endogenous genes relative to HPRT1 expression. Plotted data are mean±SD. (D) Hematoxylin and eosin–stained histologic sections of tumors derived from SCID mice after injection of CTNS−/− iPSCs under kidney capsule. All three germ layers were identified: mesoderm, endoderm, and ectoderm (n=3). Scale bar, 100 µm. (E) Schematic overview of the CRISPR-based strategy to disrupt the CTNS gene in wild-type iPSCs. The extent of the deletion in exon 8 and exon 9 is marked with black arrowheads. (F) Sanger sequencing chromatogram shows resulting sequence in CTNSKO iPSCs. PAM, protospacer adjacent motif.

