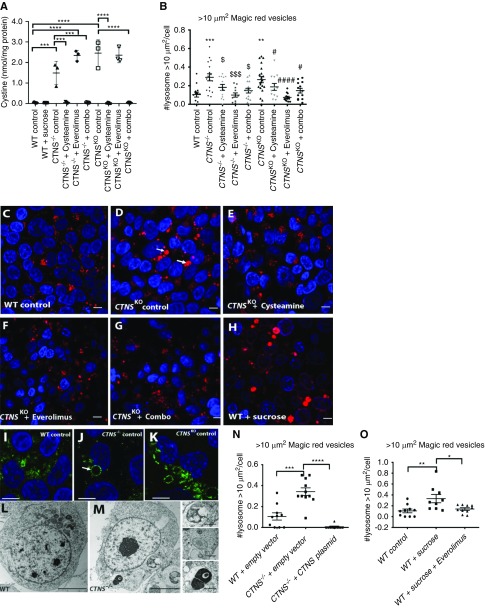
Figure 2.
CTNS iPSCs display cystine accumulation and enlarged lysosmes. (A) Amount of cystine (nmol/mg of protein) in wild type (WT), CTNS−/− iPSCs, and CTNSKO iPSCs with various treatments (1 mM cysteamine; 100 nM everolimus; combo, 1 mM cysteamine and 100 nM everolimus; 24 hours). One-way ANOVA performed, data plotted as mean±SEM, three independent experiments. **P<0.01, ***P<0.001, ****P<0.0001. (B) Graph displaying quantification of the average number of Magic Red vesicles (lysosomes) per cell over 10 µm2. One-way ANOVA performed (n=600 cells from eight to ten random fields per condition, 20 cells per field, three independent experiments), data plotted as mean±SEM. ***P=0.001, WT control versus CTNS−/− control; **P<0.01, WT control versus CTNSKO control; $P<0.05, CTNS−/− control versus CTNS−/− 1 mM cysteamine and CTNS−/−combination; $$$P<0.001, CTNS−/− control versus CTNS−/−100 nM everolimus; #P<0.05, CTNSKO control versus CTNSKO 1 mM cysteamine and CTNS−/−combination; ###P<0.001, CTNSKO control versus CTNSKO 100 nM everolimus. (C–H) Representative images of fluorescent staining with Magic Red in WT control, CTNSKO control, and CTNSKO with treatments (1 mM cysteamine; 100 nM everolimus; combo, 1 mM cysteamine and 100 nM everolimus; 24 hours) and WT iPSCs treated with 50 mM sucrose for 24 hours. Scale bar, 10 µm. (I) Representative immunofluorescence staining with anti-LAMP1 (green) in WT iPSCs, and (J) CTNS−/− and (K) CTNSKO iPSCs, respectively. Arrow indicates enlarged vesicles. Scale bar, 10 µm. (L and M) Transmission electron micrograph of (L) WT and (M) CTNS−/− iPSCs showing enlarged vesicles. Scale bars, 5 µm in (L) and 1 µm in (M). (N) Graph displaying quantification of the average number of Magic Red vesicles per cell over 10 µm2 in WT iPSCs and CTNS−/− iPSCs overexpressing empty vector (pcDNA 3.1) or exogenous CTNS-GFP. One-way ANOVA performed (n=300 cells from five to eight random fields per condition, 20 cells per field, three independent experiments), data plotted as mean±SEM. ***P<0.001, ****P<0.0001. (O) Average number of Magic Red vesicles per cell over 10 µm2. WT iPSCs treated with 50 mM sucrose or sucrose and 100 nM everolimus for 24 hours. One-way ANOVA performed (n=300 cells from five random fields per condition, 20 cells per field, three independent experiments), all data are plotted mean±SEM. *P<0.05, **P<0.01. CTNSKO, CRISPR-generated cystinotic KO iPSCs. Nuclei counterstain in (C–H) and (I–K) was Hoechst.

