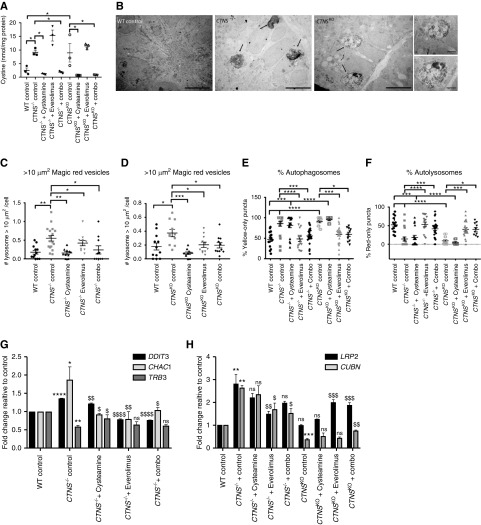
Figure 5.
Cystinotic kidney organoids derived from CTNS iPSCs display increased cystine, enlarged lysosomes, basal autphagy defects and deregulation of genes. (A) Amount of cystine (nmol/mg of protein) in wild-type (WT), CTNS−/−, and CTNSKO organoids with various treatments. One-way ANOVA performed, data plotted as mean±SEM, n=30 organoids per experiment, three independent experiments. **P<0.01, ***P<0.001, ****P<0.0001. (B) Representative transmission electron microscope images of WT, CTNS−/−, and CTNSKO organoids displaying enlarged multivesicular bodies (black arrows). Scale bar, 5 µm in (A) and 2 µm in (B). (C) Average number of Magic Red vesicles per cell over 10 µm2 in WT, CTNS−/−, and (D) CTNSKO organoids. One-way AVOVA performed, the values are mean±SEM (n=300 cells from ten random fields per condition, ten cells per field, three independent experiments). *P<0.05, **P<0.01, ***P<0.001. (E and F) Effects of 1 mM cysteamine, 100 nM everolimus, and combination treatments for 24 hours on autophagy flux as determined by the percentage of yellow and red puncta in day 14 CTNS−/− and CTNSKO organoids. One-way ANOVA performed, all data plotted as mean±SEM (n=30 cells from ten random fields per condition containing approximately one to three cells in three independent experiments). *P<0.05, **P<0.01. (G) qPCR of genes of interest in control CTNS−/− organoids with various treatments expressed as fold change relative to control, data plotted as mean±SD. One-way ANOVA performed, data plotted as mean±SD. *P<0.5, **P<0.01, ****P<0.0001, compared with relative WT control; $P<0.5, $$P<0.01, $$$$P<0.0001, compared with CTNS−/− control. (H) qPCR of Megalin (LRP2) and Cubilin (CUBN) with various treatments expressed as fold change relative to control. One-way ANOVA performed, data plotted as mean±SD. **P<0.01, ***P<0.001, compared with relative WT control; $P<0.5, $$P<0.01, $$$P<0.001 compared with relative CTNS control.

