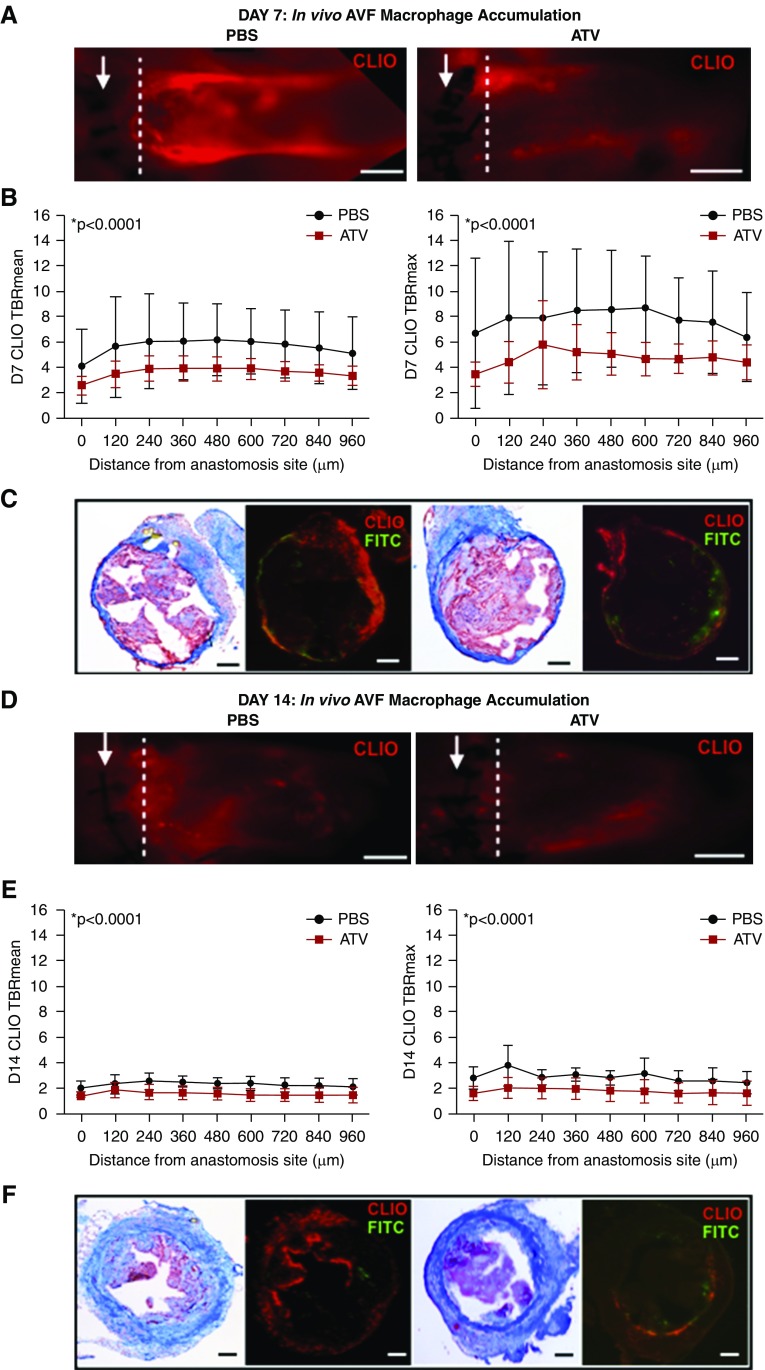
Figure 4.
ATV decreases the in vivo macrophage inflammatory response in AVFs. (A) The inflammatory response was visualized by IVM using the macrophage-sensitive nanoparticle CLIO-VT680 (red) at day 7. CLIO-VT680 signal intensity was measured at 120-μm intervals distal to the anastomosis. Arrow represents anastomosis. Scale bar, 250 μm. (B) At day 7, mean and maximum CLIO-VT680 signal intensity was significantly reduced in ATV-treated animals compared with PBS-treated animals (P<0.001). (C) Ex vivo Carstairs and fluorescence microscopy imaging were obtained and AVF structure was identified using autofluorescence (green). CLIO-VT680 signals (red) were also visualized in ex vivo fluorescence microscope. Scale bar, 100 μm. (D) Inflammatory response was visualized on IVM via a nanoreporter CLIO-VT680 (red) at day 14. Scale bar, 250 μm. (E) At day 14, mean and maximum CLIO-VT680 signal intensities were much lower in ATV-treated animals versus PBS (P<0.001). Error bars display the SD. (F) Representative ex vivo Carstairs and fluorescence microscope images. Scale bar, 100 μm. The two-way ANOVA test was used to assess for statistically significant differences in macrophage presence between ATV and PBS groups as a function of distance from the anastomosis. P<0.05 was considered statistically significant. D7, day 7. TBR, target-to-background ratio.

