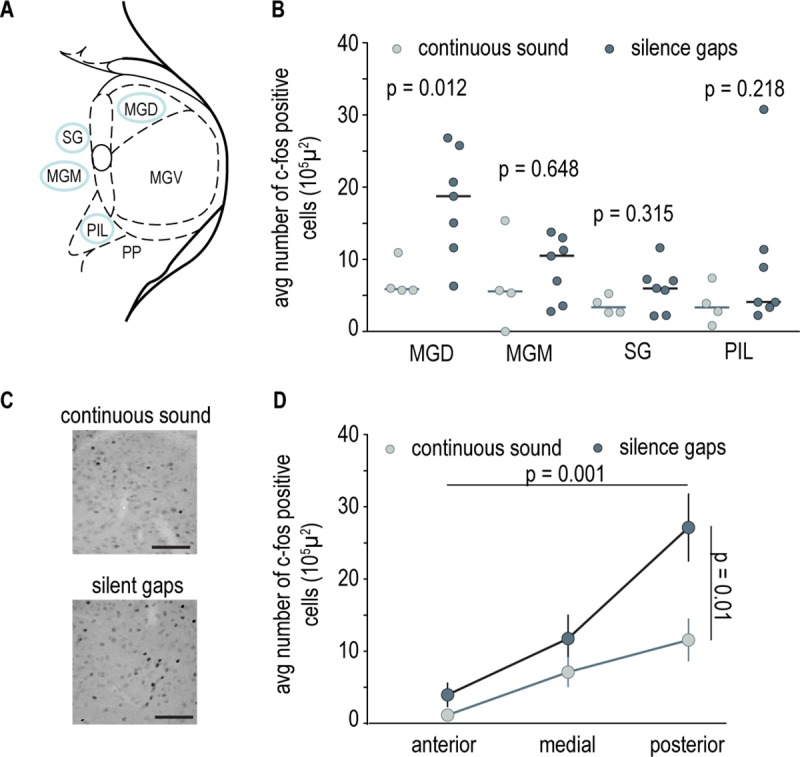
Fig 2. Differential activity in the MGD triggered by the cessation of movement-evoked sound.

(A) Schematics of the MGB and its subnuclei. Regions circled in blue are part of both the mono- and polysynaptic pathway to the LA. (B) Average number of c-fos-positive cells in the MGD and MGM, the SG, and the PIL of individual rats from the continuous sound (light gray n = 4) and silence gaps (dark gray n = 7) group. The horizontal bar represents the median value, and Wilcoxon rank sum test was used for comparisons (MGD continuous sound = 5.87, silence gaps = 18.7, rank sum = 11; MGM continuous sound = 5.54, silence gaps = 10.50, rank sum = 21; SG continuous sound = 3.36, silence gaps = 5.95, rank sum = 18; PIL continuous sound = 3.33, silence gaps = 4.07, rank sum = 17) (S1 Data, Sheet Fig 2). (C) Representative pictures of c-fos-labeled cells in MGD. Scale bar 100 μm. (D) Line graph showing average number of c-fos-labeled cells in the MGD along the anterior-posterior axis for continuous sound and silence groups. Vertical bars represent ±SEM (n-way ANOVA main effect repeated measures AP axis p = 0.001, F = 12.69; silence versus continuous sound effect p = 0.01, F = 7.71) (S1 Data, Sheet Fig 2). LA, lateral amygdala; MGB, medial geniculate body; MGD, dorsal division of the MGB; MGM, medial division of the MGB; MGV, ventral division of the MGB; PIL, posterior intralaminar thalamic nucleus; PP, peripeduncular nucleus; SG, suprageniculate nucleus.
