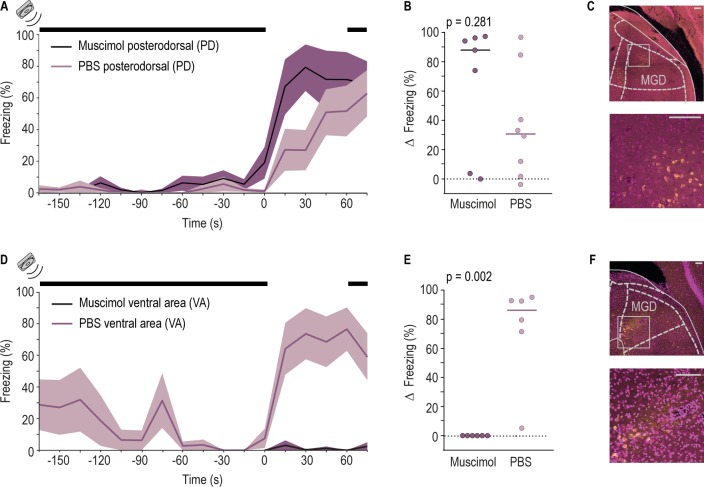
Fig 4. The VA but not the PD region of the auditory cortex is necessary for freezing triggered by silence.
(A, B) Same as Fig 1C and 1D, (respectively) but for rats with bilateral injection of muscimol (dark purple, n = 7) or PBS (light purple, n = 8) in the area PD. Horizontal bar represents the median value of the group (muscimol = 87.87%, PBS = 30.73%, Wilcoxon rank sum test, rank sum = 54). (S1 Data, Sheet Fig 4). (C) Top, coronal brain section from a representative rat in which MGD cells are labeled with CTB injected in the PD. Bottom, image with higher magnification of the area highlighted by the white square on the top image. Pink, cell bodies labeled with DAPI. Yellow, cell bodies of CTB-positive cells. (D, E) Same as (A, B) (respectively), but for rats with bilateral injections of muscimol (dark purple, n = 6) or PBS (light purple, n = 6) in VA. Horizontal bar represents the median value (muscimol = 0.00%, PBS = 86.07%, Wilcoxon rank sum test, rank sum = 57). (F) Same as (C) but for CTB injections in the VA. Scale bar 100 μm. (S1 Data, Sheet Fig 4). ArchT, archaerhodopsin from Halorubrum strain TP009; Ct ArchT, control ArchT; Ct light, control light; CTB, cholera toxin subunit B; DAPI, 4', 6-diamidino-2-phenylindole; LA, lateral amygdala; MGB, medial geniculate body; MGD, dorsal division of the MGD; PBS, phosphate buffered saline; PD, posterodorsal; VA, ventral area.

