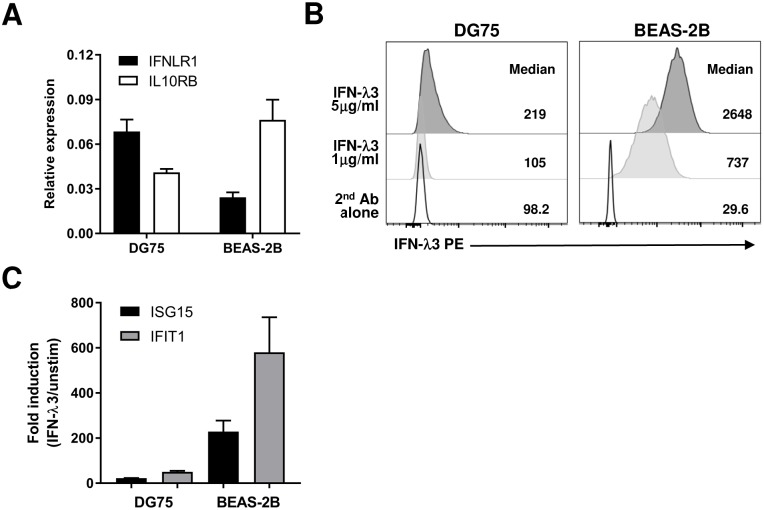
Fig 3. Greater IFN-λ3 cell surface binding and ISG induction in BEAS-2B bronchial epithelial cell line compared to DG75 B cell line mimics results seen in primary cells.
A) Normalized expression values for each subunit of the IFN-λR as determined by RT-qPCR for DG75 or BEAS-2B cell lines. Results were normalized to the geomean of HPRT1 and RPL13A reference genes. B) IFN-λ3 flow cytometry binding assay results for 0, 1, or 5 μg/ml His-tagged IFN-λ3 added to DG75 or BEAS-2B cells. C) RT-qPCR quantification of ISG15 and IFIT1 mRNA in DG75 or BEAS-2B cells induced by IFN-λ3 (100 ng/ml) as compared to unstimulated cells after 24 hrs incubation. Bar graphs (A, C) show means + SEM from 2 independent experiments and flow cytometry histograms (B) are representative of 2 independent binding assays.

