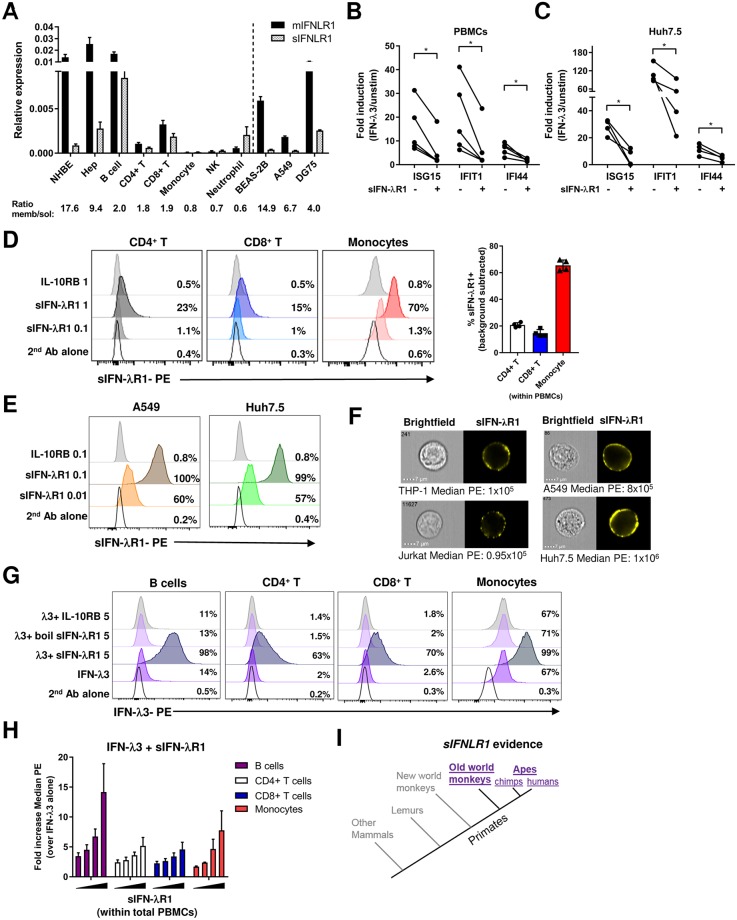
Fig 4. Soluble IFN-λR1 found in primates binds to the cell surface to increase binding of IFN-λ3 but inhibits ISG induction.
A) Normalized expression values for each variant of IFNLR1 (membrane, full length (mIFNLR1), or small, soluble (sIFNLR1)) as determined by RT-qPCR for normal human bronchial epithelial cells (NHBE), hepatocytes (hep) or immune cells purified from healthy human donor blood, or cell lines (BEAS-2B or A549 lung epithelial or DG75 B cell). Means + SEM are shown from 3–6 different donors (primary cells) or 2–3 independent experiments (cell lines). Results were normalized to the geomean of HPRT1 and RPL13A reference genes. B-C) Fold induction of 3 ISGs (ISG15, IFIT1, IFI44) by IFN-λ3 (10 ng/ml) treatment of total PBMCs (B) or Huh7.5 hepatocytes (C) relative to unstimulated cells with or without simultaneous addition of recombinant sIFN-λR1 (100 ng/ml (PBMC), 1000 ng/ml (Huh7.5)). Each dot represents a different individual or experiment. D-E) Quantification of binding of recombinant sIFN-λR1 or control IL-10RB to individual cell subsets within total PBMCs (D), or to A549 or Huh7.5 cell lines (E). Binding was detected by anti-Fc PE antibody. Histograms are representative of results from 4 different PBMC donors (bar graph right panel D), or from 2–3 independent experiments (E). F) Imaging flow cytometry visualization of binding of sIFN-λR1 (500 ng/ml (A549, Huh7.5), 1 μg/ml (THP-1, Jurkat)) to 4 cell lines. The median PE intensity is shown below each representative image from 6,000–12,000 total cells acquired from 2–3 independent experiments. G-H) IFN-λ3 binding to cell subsets within PBMCs where IFN-λ3 (2 μg/ml) was added with or without sIFN-λR1 (0.5–5 μg/ml +/- boiling) or IL-10RB (5 μg/ml). Percent IFN-λ3 bound and fold increase in median PE fluorescence are representative from 2–4 donors (G) or plotted as means + SD from 2–4 different donors (H). I) The presence of a soluble IFNLR1 variant within primates and lower mammals. Gray indicates no annotation and no transcript detectable in deposited RNA sequencing data, and purple indicates both annotation and detection of RNA transcript in multiple cell types from deposited RNA sequencing data. *, P<0.05, paired t-tests (B-C).

