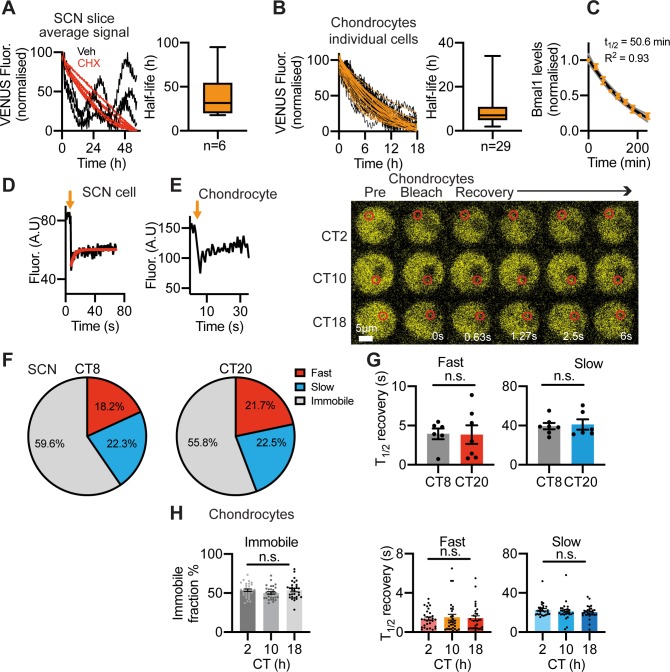
Fig 4. Quantitative analysis of Venus::BMAL1 cellular behaviour.
A, B) Half-life of Venus::BMAL1 in SCN and chondrocytes was measured by time-lapse microscopy. A) Organotypic SCN slices were treated with cycloheximide (CHX) (40 μg/mL) to stop de novo protein synthesis. Normalised average Venus fluorescence signal from confocal time-lapse recordings of CHX-treated (n = 6 red traces) were compared to vehicle-treated control slices (n = 3 black traces). Note that decline in signal was not complete after 60 hours, thus, half-life measures were estimated from best-fit. Box and whisker plot showing median and interquartile ranges for the half-life of Venus::BMAL1 in SCN slices. B) (Left) Venus::BMAL1 half-life in primary chondrocytes (n = 29 cells). Cells were treated with CHX 5 μg/mL to stop de novo protein synthesis. Right) Box and whisker plot showing median and interquartile ranges for the half-life of Venus::BMAL1 in chondrocytes. C) Bmal1 mRNA stability in primary chondrocytes. Time (min) is following actinomycin D treatment (5 μg/mL). D) Example FRAP experiment showing partial fluorescence recovery after nuclear bleach in the SCN at CT20. E) FRAP analysis in the nucleus of chondrocytes. Left: Fluorescence recovery curve after nuclear bleach. Right: Representative fluorescence images of FRAP experiments in chondrocytes at CT2, 10 and 18. CT0 represents 24 hrs post-dexamethasone. F) FRAP analysis in the nucleus of the SCN revealed two components (fast and slow) of the diffusion kinetics of Venus::BMAL1, as well as an immobile fraction. Pie charts for FRAP analysis of SCN slices at CT8 and CT20 (relative to PER2::Luc rhythms) show percentage of signal explained by fast component, slow component and immobile component in 2-component diffusion model. G) Mobility of Venus::BMAL1 molecules expressed as t1/2 of FRAP recovery. Both the fast component (left) and slow component (right) lack a time-of-day effect (mean ±SEM; n = 6). Data were fitted to a 2-component diffusion model, where a fast and a slow component were identified. Note, such high mobility of BMAL1 is in line with other transcription factors in the cell nucleus, but contrasts with the slow kinetics of DNA-bound histones (T1/2 in the hours range). H) FRAP analysis in the nuclei of chondrocytes at CT2, 10 and 18. Recovery curves were also fitted to a 2-component diffusion model. Left: % non-recovery signal, i.e. immobile Venus::BMAL1 fraction; middle: fast component; right: slow component (data were calculated based on results from ~30 cells per group, mean ±SEM).

