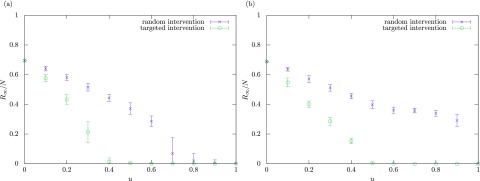
FIG. 7.
Numerical results for the final epidemic size with different values of the intervention rate . The mobility rate is fixed at . The crosses and open circles indicate the average values over 50 simulations for the random and targeted interventions, respectively. The error bar indicates the standard deviation. (a) Scale-free patch networks generated with the configuration model [50]. (b) The U.S. airport network [40].

