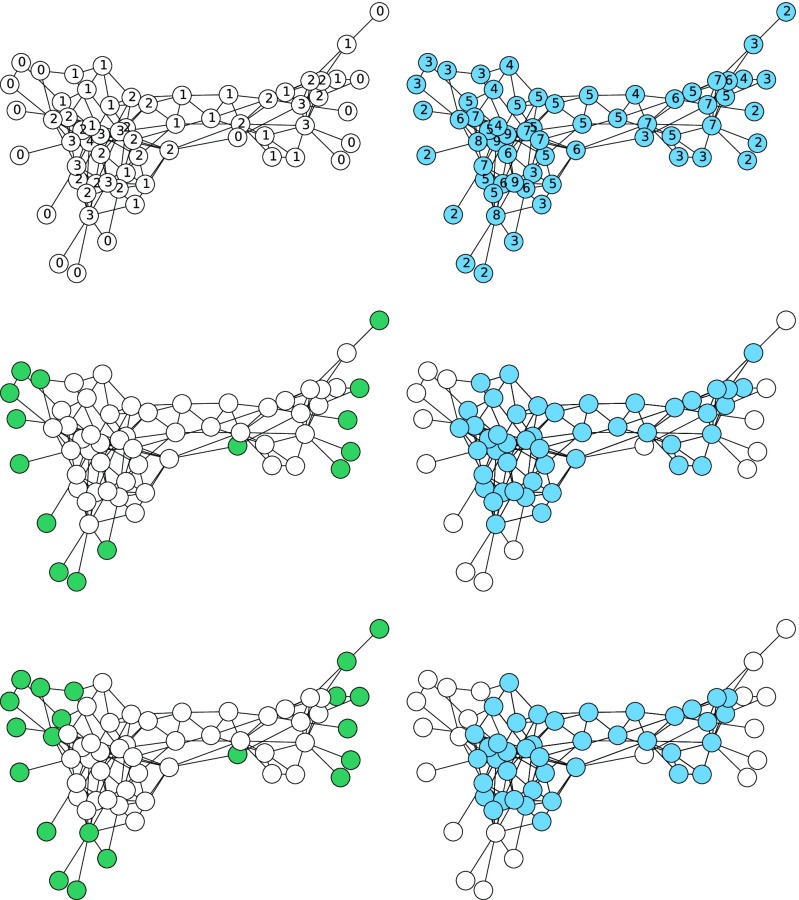
FIG. 3.
A comparison of heterogeneous bootstrap and heterogeneous -core percolation for the social network of dolphins observed by [38]. Left: heterogeneous bootstrap percolation. Top: thresholds for activation, . Middle: first step: all nodes of degree 1 or 2 are activated. Bottom: second step: nodes that now reach their threshold are activated. Right: heterogeneous -core percolation. Top: thresholds for deletion, . Middle: first step: all nodes of degree 1 or 2 are deleted. Bottom: second step: nodes that now reach their threshold are deleted. The nodes deleted at each stage of -core percolation correspond exactly to the nodes activated at the same stage of bootstrap percolation.

