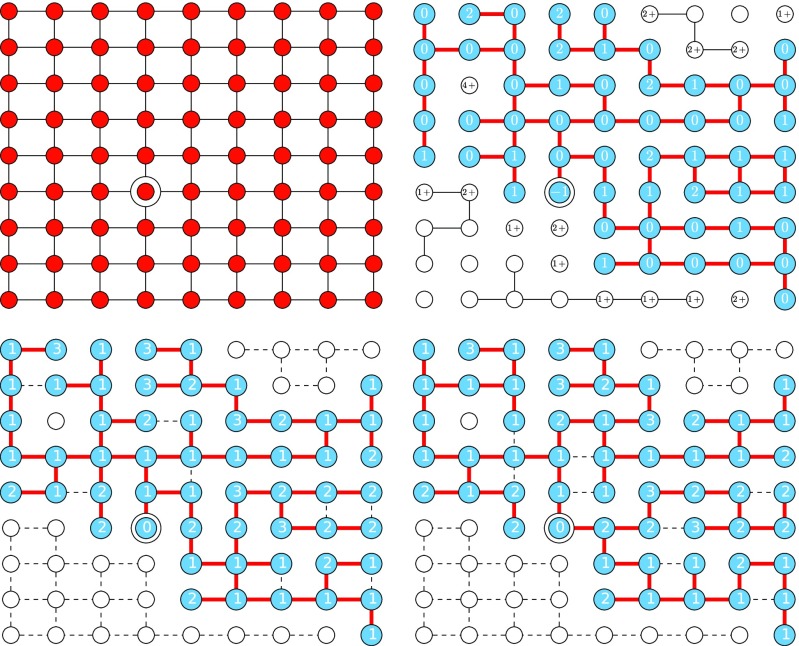
FIG. 4.
Top left: original network, with the initial node highlighted. Top right: percolated network with the component of the initial node highlighted taking . Edges shown within a component are red, while edges in other components are black. Bottom left: WTM outcome with thresholds found from the percolated network using a breadth-first search for the WTM. Bottom right: WTM outcome with thresholds from the percolated network using a depth-first search for the WTM. In both WTM plots, the edges that were responsible for the activation of a node are shown in red. Edges that were never considered are shown dashed in black.

