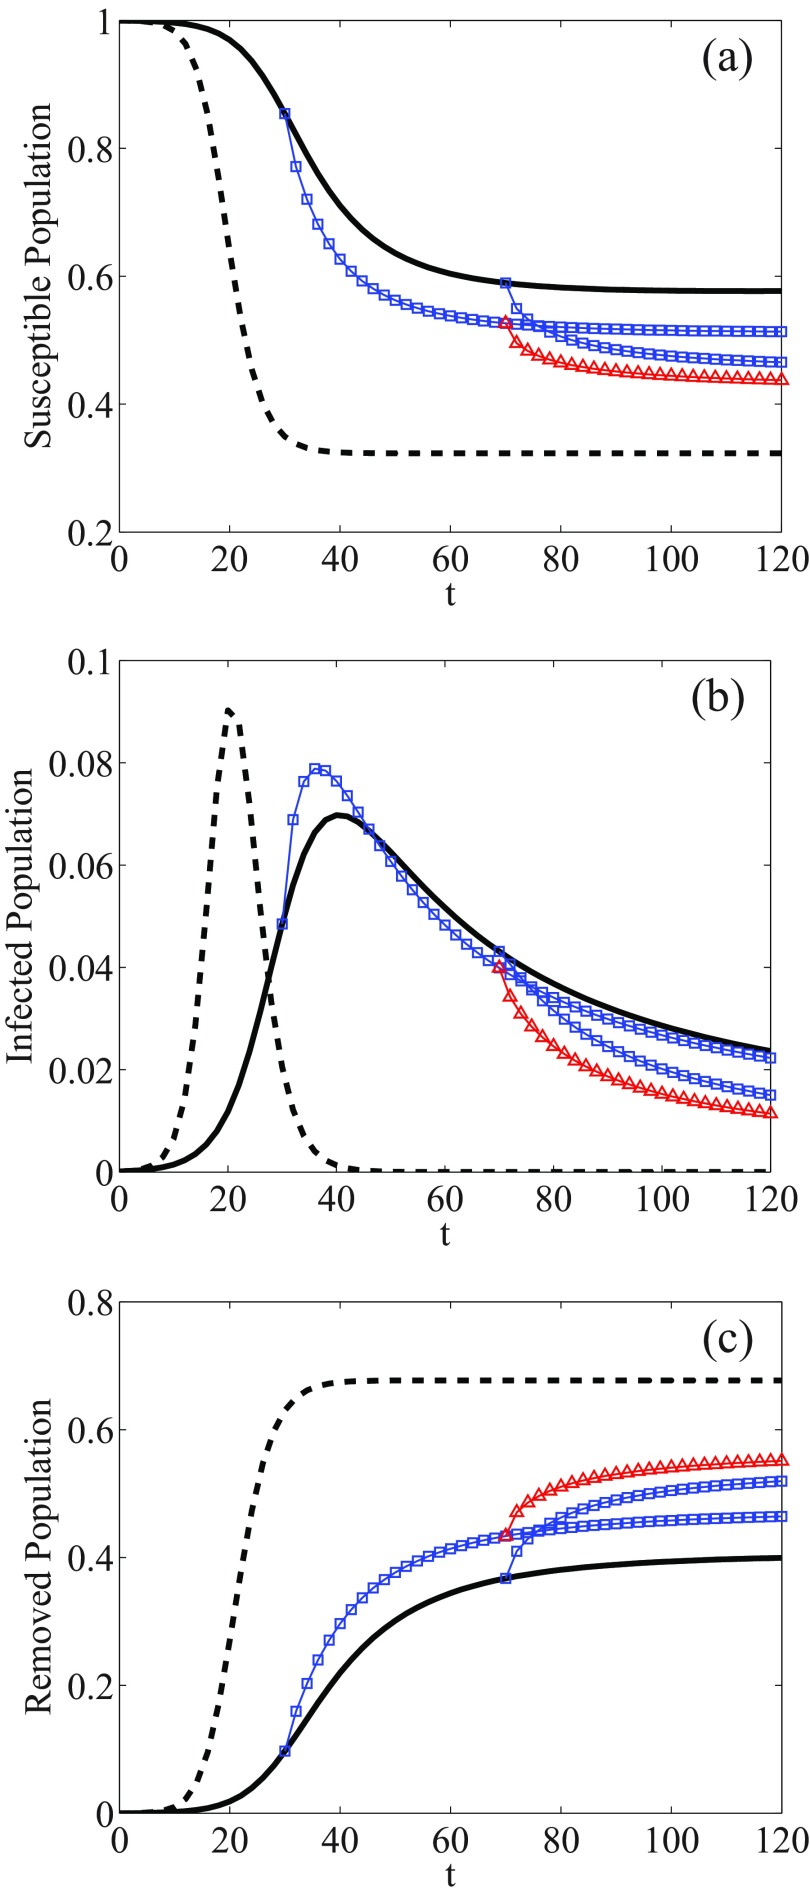
FIG. 5.
Effect of different initial times on the dynamics of a non-Markovian process. The curves denote the fraction of (a) susceptible, (b) infected, and (c) removed individuals. Dashed and solid lines correspond to Markovian and non-Markovian processes, respectively, started from . The curves with symbols correspond to the dynamics of non-Markovian processes, started from nonzero initial times with different initial conditions.

