Abstract
A major hurdle in the simulation of the steady state of epidemic processes is that the system will unavoidably visit an absorbing, disease-free state at sufficiently long times due to the finite size of the networks where epidemics evolves. In the present work, we compare different quasistationary (QS) simulation methods where the absorbing states are suitably handled and the thermodynamical limit of the original dynamics can be achieved. We analyze the standard QS (SQS) method, where the sampling is constrained to active configurations, the reflecting boundary condition (RBC), where the dynamics returns to the pre-absorbing configuration, and hub reactivation (HR), where the most connected vertex of the network is reactivated after a visit to an absorbing state. We apply the methods to the contact process (CP) and susceptible-infected-susceptible (SIS) models on regular and scale free networks. The investigated methods yield the same epidemic threshold for both models. For CP, that undergoes a standard collective phase transition, the methods are equivalent. For SIS, whose phase transition is ruled by the hub mutual reactivation, the SQS and HR methods are able to capture localized epidemic phases while RBC is not. We also apply the autocorrelation time as a tool to characterize the phase transition and observe that this analysis provides the same finite-size scaling exponents for the critical relaxation time for the investigated methods. Finally, we verify the equivalence between RBC method and a weak external field for epidemics on networks.
I. INTRODUCTION
Nonequilibrium phase transitions are observed in many physical, biological, social, and chemical systems [1–3], to mention just a few examples. A fundamental class of nonequilibrium phenomena is the absorbing-state phase transition (APT) [1,2,4] that occurs when the system has accessible states where the dynamics remains permanently stuck, strongly violating detailed balance and thus implying the absence of equilibrium counterparts. One of the characteristic features of APTs is the interplay between the propagation and annihilation of particles that can represent hosts for an infectious disease, microorganisms, molecules in catalytic reactions, etc. When the ratio between propagation and annihilation is below a threshold, the density of active particles vanishes and an APT takes place.
A fundamental model that exhibits an APT is the contact process (CP) [5], where infected individuals lying on a substrate (originally a lattice [5] but it was later extended to networks [6]) can spontaneously be cured or infect one of their nearest neighbors. From the epidemiological viewpoint, the susceptible-infected-susceptible (SIS) model is canonical [7]. In SIS, the cure is the same as in CP, but the infection is transmitted at a rate to each healthy neighbor of an infected vertex, while in CP the infection rate is divided by the vertex degree. On lattices, SIS and the CP have the same critical behavior belonging to the directed percolation (DP) universality class [4]. However, the nature of the phase transition of these models are different on complex networks with power-law (PL) degree distributions given by , where is the probability that a randomly chosen vertex of the network connects to other vertices. While CP exhibits a transition at a finite threshold that involves the collective activation of the entire network [8], the transition of the SIS model occurs at a threshold that goes to zero in the thermodynamical limit and is triggered by the mutual reactivation of hubs (vertices with very large degree) [8,9].
Many dynamical processes exhibiting distinct types of APTs have been intensively studied on lattices [1–4]. However, the behavior of this kind of process is strongly affected by the structure, in the form of a network, that connects the system components and mediates their interactions [10,11]. The former investigations of an epidemic spreading on complex networks [7,12–14], which later revealed many remarkably properties and puzzling outcomes [15–20], were subsequently followed by a diversified analysis of other kinds of APTs on networks [6,21–28].
The large amount of gathered data regarding real networks [29], the recent advances on complex network theory, and the increased computational power are among the factors that leveraged the modern research on networks and dynamical processes taking place on them. Even for simple dynamical processes most of the exact results are bounds [11] and analytical approximations based on mean-field theories are generically used to quantitatively predict the behavior of such processes on networks [10,11]. Dynamical correlations play an important role irrespective of the infinite dimensionality of networks [30–32] and mean-field theories are approximations that call for complementary analysis based on computer simulations. For example, the existence of localized epidemic phases [17,18,33,34] and the slow subcritical dynamics due to rare (locally supercritical) regions [20,33,35,36] on networks with PL degree distribution have recently been discussed, grounded on simulations. Notice that localization is related to metastability at subcritical phases [35] and can play an important role in the quasistationarity of the dynamical process.
A major hurdle in the simulations of APTs is that they are unavoidably performed in finite-size systems and for sufficiently long times an absorbing state is always visited due to the finite number of accessible configurations, implying that the unique real stationary state is an absorbing one [4]. Moreover, standard dynamic methods for simulations of APTs as, e.g., spreading or decay simulations [4], are not effective in complex networks due to the small-world property [29] that makes the dynamics to probe the network finiteness very quickly. An alternative is to consider the so-called quasistationary (QS) state where the original dynamics is perturbed to skip the absorbing state in a such way that this perturbation becomes irrelevant in the infinite-size limit for all intensive quantities of interest and a finite-size scaling (FSS) technique provides the correct thermodynamical limit as well as the critical exponents associated with the APT [1,4].
The standard QS (SQS) method consists in performing averages only over the samples that did not visit an absorbing state [4]. Also, a reflecting boundary condition (RBC), where the evolution returns to the pre-absorbing state when it visits an absorbing one, can be easily applied [37]. Another approach1 is to include an external field (EF) [1,39,40], conjugated to the order parameter, that continuously and noncorrelatively introduces activity. If the field is sufficiently weak it becomes equivalent to the RBC method [40], which in turn, provides the same critical points and FSS of the critical density of the SQS method in lattice systems [40,41].
The SQS method has been used to investigate the APT of the CP model on networks with a PL degree distribution showing very good agreement with the critical exponents obtained by a heterogeneous mean-field (HMF) theory [28,31]. This method was also applied to numerically determine the epidemic threshold of the SIS model as a function of the network size [18,42]. Besides a vanishing threshold [42], the SQS method was applied to investigate multiple transitions [18] and localization [36] of the SIS model on networks with a PL degree distribution. The EF method with a finite source was also applied to the SIS model [43]. In Ref. [17], a simulation strategy was adopted wherein the most connected vertex of the network is never cured. However, a systematic comparison among different methods remains lacking.
In this work, we compare the outcomes of RBC and SQS methods in the APT of the CP and SIS models in regular and PL networks. We apply the integrated autocorrelation time of QS time series as a measure of the characteristic relaxation time instead of the usual average time between two consecutive visits to be the absorbing state because the latter does not represent the relaxation time in RBC method. For heterogeneous networks, we also investigate an alternative version of the RBC method, called hub reactivation (HR), where the dynamics always restart in the most connected vertex of the network. This method resembles the strategy used in Ref. [17]. Finally, we extend the results of Ref. [40] to networked substrates, confirming that the weak limit of EF (WEF) method is equivalent to RBC.
In summary, we observe that the SQS, RBC, and HR methods provide the same threshold and critical exponents for CP on complex networks and regular lattices. For the SIS model on networks with a PL degree distribution [44], SQS and HR methods differ from the RBC method in some relevant aspects. For instance, the first and second ones capture activated configurations which are highly localized around the most connected vertex of the network, while the last one does not.
The sequence of the paper is organized as follows. The theoretical background for the different QS methods is presented in Sec. II. In Sec. III, we describe CP and SIS models with their computer implementations. Numerical methods to characterize the critical point including the integrated autocorrelation time are presented in Sec. IV. The results along with the associated discussions are in Sec. VI and we summarize our findings in Sec. VII.
II. QUASISTATIONARY STATES
The terminology QS is commonly attributed to averages restricted to samples that did not visit an absorbing state of the original dynamics [4]. Here, this term is used in a more general context, in which the dynamical process is perturbed to prevent the system from getting trapped into absorbing states but assuring that intensive QS quantities converge to the stationary ones in the thermodynamical limit.
In order to comprehend some basic concepts necessary to develop the QS methods, let us consider a one-step process , in which only transitions are permitted [45], with states labeled by and the state is absorbing. Now, lets be a similar process where the unique difference is that the state is not absorbing anymore. For , the evolution of is the same as unless, at most, by some perturbation in the rules that must be negligible in the active phase in the thermodynamical limit. The process returns to a state after some time, whenever the system visits an absorbing state.
Let and be the probabilities to be in the state in the original and modified dynamics, respectively. The master equation [45] for the original process reads as
| (1) |
where is the transition rate from to . Introducing a perturbative source of activity to remove the absorbing state, the new dynamical equation2 becomes
| (2) |
where the functional will depend on the particular QS method. The basic QS quantities of interest can extracted from the QS distribution yielded by the stationary solution of Eq. (2).
A. Standard QS method
This method consists in performing averages only over samples that did not visit an absorbing state. The QS distribution of the original dynamics is given by
| (3) |
where
| (4) |
is the probability that the epidemics is active at time . In practice, this strategy is troublesome since critical and subcritical simulations in finite size get constantly trapped into absorbing states, resulting in short and noisy intervals of stationary data. de Oliveira and Dickman [41] proposed a clever strategy to circumvent these problems: Every time the dynamics visits an absorbing state, the system jumps to an active configuration selected according to the QS probability. The source term in Eq. (1) is thus given by [41], where is the total rate of entering into the absorbing state. One can verify that the stationary solution of Eq. (2) with this source term corresponds to the QS solution of Eq. (1); see Ref. [41] for details.
Differentiating Eq. (4) and assuming that the QS regime exists as we find that
| (5) |
where we used the master equation (1) for and for . The solution is , where
| (6) |
is the typical relaxation time to decay from an active QS state to an absorbing configuration that also corresponds to the time between two consecutive visits to an absorbing state during the QS regime.
The difficulty to translate this theoretical analysis into a simulation scheme is that we have no prior knowledge of the QS probability distribution. Computationally, it can be done by constructing and constantly updating a list with configurations visited along the simulation. This list is used to randomly select the new state after a visit to an absorbing state. To grant convergence to the QS state, the list, which is finite, is constantly updated by substituting a randomly selected element of the list by the current system configuration with probability per unit of time . The convergence of this method to the standard QS state, defined by Eq. (3), was recently addressed [46].
B. Reflecting boundary condition method
The absorbing phase can be avoided by bringing back the system to the configuration that it was immediately before the visit to the absorbing state, representing a reflecting boundary condition [37]. We permit states with being visited but it returns to the previous active state with rate 1. The source term in Eq. (2) becomes . The QS distribution is given by
| (7) |
For , Eq. (2) simplifies to
| (8) |
In the QS regime we have . To calculate the time between two visits to the absorbing state, the epidemic lifespan, consider a discrete dynamics of time step , the mean time that the system lasts in the absorbing state. The system is or is not in a state with probabilities and , respectively. If the system is active in step , the probability that it stays active for steps corresponds to stay in a state for steps and returns to at step , which is given by . The average time between two visits to the absorbing state is
| (9) |
recovering Eq. (6). Notice that this time differs from that of the SQS method since it is the average time to visit the absorbing state starting from a single infected vertex and not from an arbitrary QS state, as discussed in Sec. II A. Thus its scaling properties are different. Lets us consider a spreading process on a lattice of dimension . The probability that the dynamics is active at time starting with a single infected vertex is and, at the critical point, this quantity scales as [4] where the finite size of the lattice is probed at a characteristic time [4], being the number of sites3 of the lattice of length . So, the average time between two visits to the absorbing state is given by
| (10) |
for smaller than the upper critical dimension for which [4]. The last integral is obtained with Eq. (4) and an integration by parts and was evaluated using the saddle-point method. Above the upper critical dimension, corresponding to the mean-field level that we are mainly interested in, we have and [47,48]. Evaluating the integral for , we find increasing logarithmically with the system size.
C. Hub reactivation method
In the case of heterogeneous networks, we also investigate an alternative to the RBC method where, after visiting the absorbing state, the infection always restarts in the most connected vertex of the network or in one of them if there are multiple. This strategy favors the onset of outbreaks since hubs are usually prone to spread the activity. The motivation of this method is the existence of localized active phases around the hubs in SIS-like dynamics [18], which are suppressed by the RBC method. In Sec. VI, this point will be made clear.
D. External field method
In this method, the system is coupled to a uniform external field that spontaneously creates activity at a rate chosen to vanish as [40]. The source term in Eq. (2) is , that accounts for the incomes and outcomes of due to the spontaneous creation. For the absorbing state we have
| (11) |
implying for . Using Eq. (9) we have that , where was used.
The critical density produced by a small external field scales as , where is a critical exponent [4]. The QS density scales as . Imposing that the critical density of particles produced by the external field is negligible when compared with the QS density and assuming , we have that the condition is satisfied for ; the last inequality is verified considering the critical exponents and for DP in and , respectively [1]. The total creation in absorbing states goes to zero in the thermodynamical limit and the dynamics gets trapped for diverging times into the absorbing states. Computationally it is not a problem since it is implemented as a time step ; see Sec. III B. Hence, we must construct the QS distributions using only the nonabsorbing part of the simulations as
| (12) |
and .
III. MODELS AND ALGORITHMS
A. Models
The CP model was originally proposed as a simple model for epidemic propagation on a lattice [5]. For a more general case, we consider a connected graph with vertices and a quenched (not changing in time) connection structure. Each vertex of the network has edges connecting to nearest neighbors and can be either infected () or susceptible (). Infected vertices spread activity through the network by direct susceptible contacts. An infected vertex transmits the infection to each of its susceptible nearest neighbors with a rate , in which is the control parameter. In turn, infected vertices become spontaneously susceptible with rate 1 fixing the time unit. In SIS model, the infection rate is for each edge connecting infected and susceptible vertices irrespective of their degrees while the healing process is the same of CP. So, one can easily realize that the state for all vertices is absorbing in both models. The limit between persistence and extinction of activity is delimited by a critical value of the control parameter. The density of infected vertices at the stationary state, , is the order parameter that is null in the absorbing phase and reaches a steady value for .
Contrasting with homogeneous graphs, SIS and CP are very different for heterogeneous networks. Distinct analytical approaches were devised to determine an expression for and the respective critical exponents in random networks with PL degree distributions, for both SIS [7,9,15,19,43,49,50] and CP [6,26,27,31,51–53]. The central results are that, in the thermodynamical limit, CP has a finite threshold and undergoes an APT with well-defined FSS exponents. For infinite-size PL networks, the SIS model does not exhibit an APT such that an endemic active phase is observed for any finite infection rate . However, for finite sizes the SIS effectively has a threshold [9,15,17,18,30,42] and the APT, including FSS exponents, can also be investigated numerically.
B. Algorithms
For the SQS, RBC, and HR methods with , the simulations of the SIS dynamics were performed according the adapted Gillespie algorithm presented in Refs. [18,42]. At each time step, the number of infected vertices and the sum of the degrees of these vertices are computed. With a probability a randomly chosen infected node becomes healthy. With the complementary probability , an infected vertex is chosen proportionally to its degree and one of its links is chosen with equal chance. If the selected link points to a susceptible vertex it becomes infected; otherwise the simulation continues. The total number of infected nodes and the number of links emanating from them are updated, time is incremented by , where4 , and the entire process is iterated. If the system visits the absorbing state, the rules described in Secs. II A, II B, or II C are applied, returning to an active state. It is worth noting that this algorithm is statistically exact in the same sense as the Gillespie algorithm.
For the EF method, a third possible event is defined: The spontaneous infection of a randomly chosen site with rate . In this case, a chosen infected node becomes healthy with probability , the transmission of the infection is tried with probability , while spontaneous creation at a randomly chosen vertex is tried with the complementary probability . If the chosen vertex is susceptible it becomes infected; otherwise the simulation goes on. The time increment is .
The simulations of the CP were done using the standard procedure [4]. At each time step, an infected vertex is chosen with equal chance and attempts to infect one of its nearest neighbors, randomly selected, with probability . Annihilation of a randomly chosen infected vertex occurs with the complementary probability . Time is incremented by and the whole process is iterated. For the EF method, the probabilities are , and for spontaneous infection, catalytic infection and spontaneous healing, respectively, and the time step is .
The relevant QS quantities are calculated during an averaging time , after a relaxation time . The QS probability is computed during the interval , such that each active configuration contributes to the QS distribution with a weight proportional to its lifetime . In networks, we used typically , and , the last one in SQS method. For lattices, was used. For very supercritical simulations shorter times are used.
IV. NUMERICAL CHARACTERIZATION OF THE CRITICAL POINT
A. Susceptibility and epidemic lifespan
The critical behavior of nonequilibrium processes presents diverging correlation length and time. The former makes little sense for complex networks because of the small-world property stating that average distance between two vertices increases logarithmically or slower with the network size [29]. However, the concept of diverging temporal correlations can be applied to identify and characterize the APT [17,18,31,42,54,55]. The susceptibility defined as [42]
| (13) |
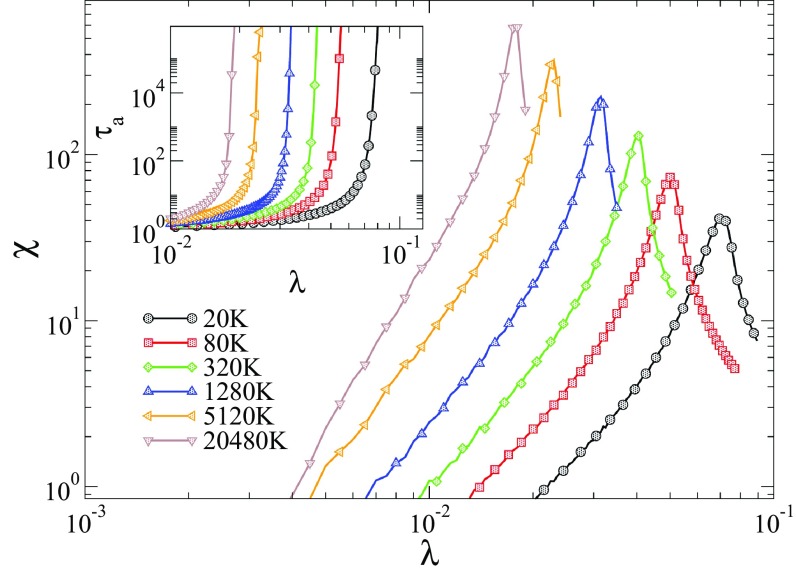
exhibits a peak that diverges as size increases at the transition point for SIS on uncorrelated networks with degree exponent [17,30,42] and CP on complex networks in general [31,56]. This peak will be used to estimate the effective, size-dependent thresholds . Figure 1 shows the susceptibility and the lifespan (inset) for different network sizes obtained with the SQS method. Note that for all curves shown, diverges approximately at the same position where the peaks of the susceptibility curves are located. Using the lifespan as an order parameter is not possible due to its divergence in the active phase. Hence, we consider the integrated autocorrelation time in the next subsection. In the case of multiple peaks in the susceptibility curves [42], the epidemic threshold is taken as the one occurring nearest to the lifespan divergence [18].
FIG. 1.
Main panel: Susceptibility vs infection rate for the SIS model on UCM networks [57] with a PL degree distribution with and different sizes using the SQS method. Inset: Lifespan vs infection rate. The network sizes are indicated in the legend.
B. Autocorrelation time
The autocorrelation time of a series is defined as [58]
| (14) |
where is the autocorrelation function given by
| (15) |
and is a time series built recording the density in the QS regime between time intervals . Here, brackets represent time averaging over at the QS regime. To prevent spurious behavior in the subcritical phase with the SQS method, the time series must be rid of big gaps. So, every time a new configuration is randomly selected to replace the absorbing state, we discard an interval of the time series in a such a way that the number of infected vertices before and after the replacement differs at most by . For RBC, HR, and EF methods this problem does not exist. Large time series with at least points were used to calculate near and below the epidemic thresholds. The autocorrelation function of long time series is efficiently computed as the inverse Fourier transform of the power spectrum of the series [58].
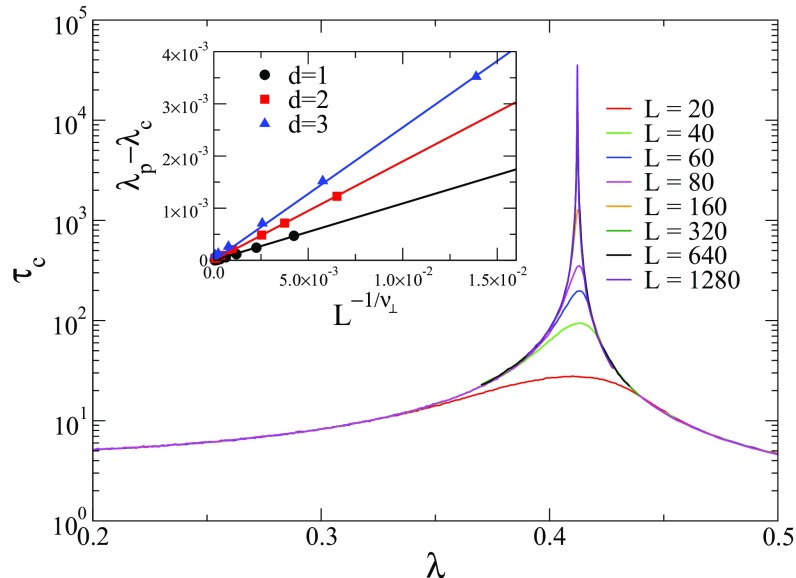
To validate the method, we performed simulations of the critical SIS model on hypercubic lattices of dimensions , 2, and 3 with periodic boundary conditions. Figure 2 shows the autocorrelation time against infection rate for SIS model in square lattices of different sizes exhibiting a pronounced diverging peak as the lattice size increases. The position of the peak converges to the expected SIS threshold5 in , 2, and 3 following the standard FSS [1]
| (16) |
where is the critical exponent associated with the divergence of the correlation length; see the inset of Fig. 2.
FIG. 2.
Autocorrelation time against infection rate for SIS model on square lattices of different sizes being the sharper the larger the size. The simulation method is SQS. Inset shows the FSS of the epidemic threshold for .
V. COMPARISON OF THE SQS AND RBC METHODS IN REGULAR GRAPHS
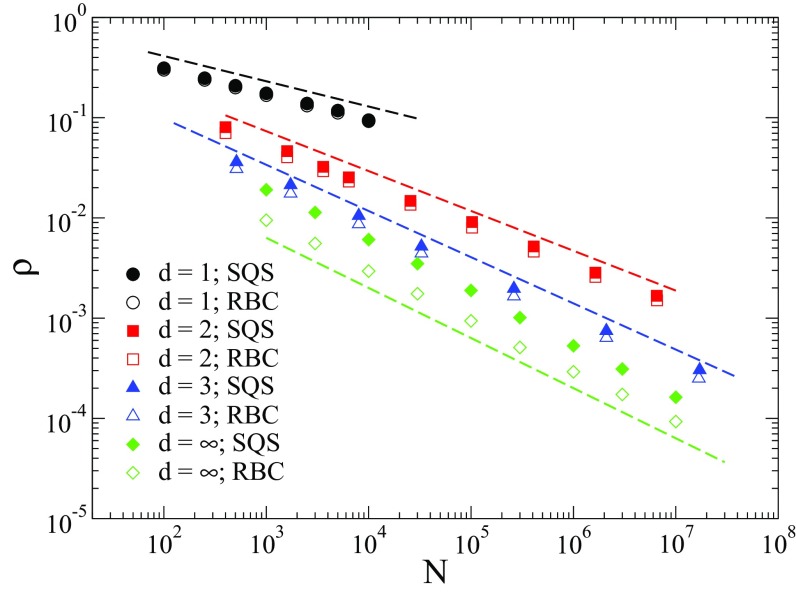
Figure 3 shows the QS density for critical SIS against the number of vertices ( for lattices) in -dimensional hypercubic lattices and in random regular networks (RRN) [56]. In the last one, all vertices have the same degree and connections are random [42], implying that RRN corresponds to an infinite dimension. Power-law decays in the form with the expected exponents , 0.3978, 0.4640, and for DP class in dimensions [1] and [47] are observed in both SQS and RBC methods. The different QS methods correspond to distinct strengths of perturbation of the system. Thus the critical quantities do not have to be identical but only present the same scaling to grant equivalence among methods.
FIG. 3.
QS density against number of vertices for critical SIS on lattices of dimensions , 2, 3 and RRN () using SQS and RBC methods. Dashed lines represent the scaling exponents of the DP class [1].
Figure 4(a) compares the critical epidemic lifespan as a function of the size for SQS and RBC methods. The DP scaling laws , with , 0.8830, and 1/2 for , 2, and , respectively, are confirmed for SQS method while the DP exponents and 0 (logarithmic) are observed for RBC, confirming the prediction of Eq. (10). Figure 4(b) compares the integrated autocorrelation times for SQS and RBC at the critical point. One can see that the same scaling law is found, showing that this quantity provides a correct characteristic relaxation time for both methods.
FIG. 4.
(a) Lifespan of the critical SIS dynamics on lattices of dimensions , 2 and RRN (). Solid lines represent the DP exponents predicted by the SQS () and dashed ones represent RBC methods . (b) Critical integrated correlation time against size. Solid lines are PLs with the DP exponents.
VI. NUMERICAL ANALYSIS ON POWER-LAW DEGREE DISTRIBUTED NETWORKS
We consider networks with PL degree distributions of the form generated by the uncorrelated configuration model (UCM) [57]. The network is built associating the number of stubs of each vertex according the distribution , randomly connecting stubs, avoiding self- and multiple connections, and imposing the minimal degree and the structural upper cutoff in the degree distribution. This procedure guarantees the absence of degree correlations for any value of [57]. We analyze values of for which SIS has distinct behaviors on UCM networks of finite size [8]. For , SIS exhibits a single well-resolved transition occurring at a threshold that goes to zero in the thermodynamical limit while for the model has localized active phases leading to multiple smeared transitions for large networks [18,36]. In the case of CP, a sharp transition occurring at a finite threshold is observed for any value of [28,31]. We consider only the case where the critical exponents depend on [27].
A.
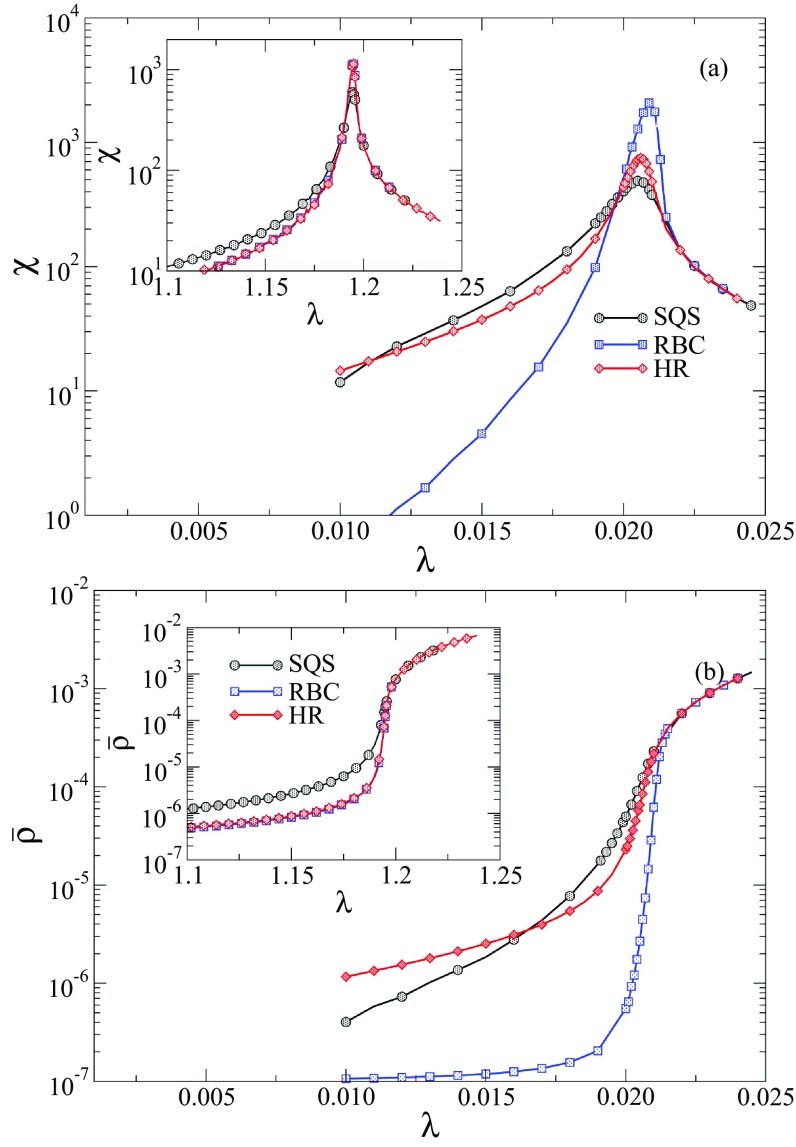
A comparison of susceptibility curves obtained with RBC, SQS, and HR methods for SIS and CP models is shown in Fig. 5(a) for a network with vertices. The three methods are equivalent for CP: The transition is slightly less pronounced in SQS than RBC and HR, but the last two are indistinguishable. For SIS, the susceptibility peak obtained with RBC is evidently more pronounced than with HR method, despite their algorithmic similarity: The latter exhibits susceptibility close to the one of the SQS method, indicating a smearing of the transition [36] in SQS and HR when compared with RBC. This phenomenon is also evidenced by the curves of density against infection rate shown in Fig. 5(b), in which the subcritical density in the SQS and HR methods are broader than in RBC.
FIG. 5.
Comparison of QS quantities on SF networks. (a) Susceptibility and (b) order parameter in the QS regime as a function of for the SIS and CP (insets) models using different methods. The degree exponent is and the network size is .
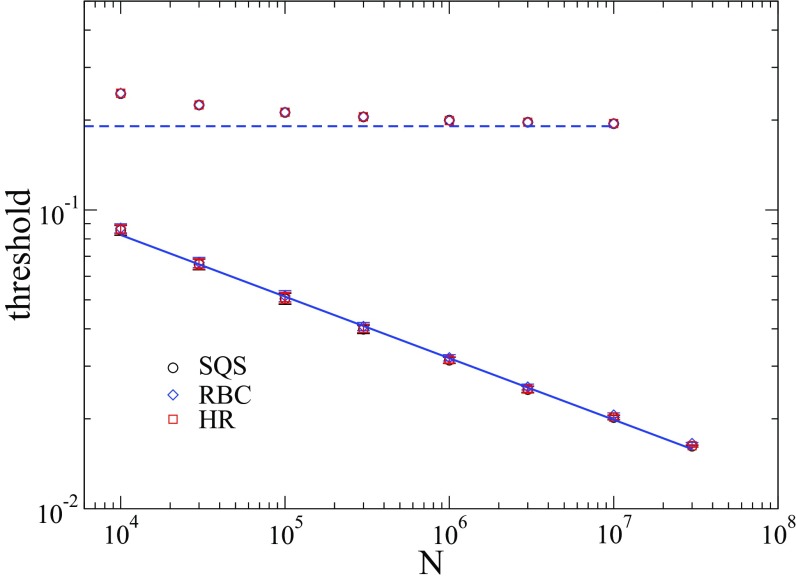
The position of the susceptibility peaks is practically independent of method used, as shown in Fig. 6. In the case of SIS, RBC provides peaks slightly above other methods, a difference that is not perceivable in this plot. Fitting SIS data to a PL , the exponent is for the three methods. For CP the convergence to the threshold value reported in Ref. [31], for this same network model, is verified with the three methods.
FIG. 6.
Effective thresholds as a function of for the SIS (bottom curves) and CP (top curves) models obtained with SQS, RBC, and HR methods. The CP threshold was subtracted by 1 to improve visibility. The solid line is a PL regression and the dashed one is the epidemic threshold of the CP in the limit of very large networks given in Ref. [31]. The degree exponent is .
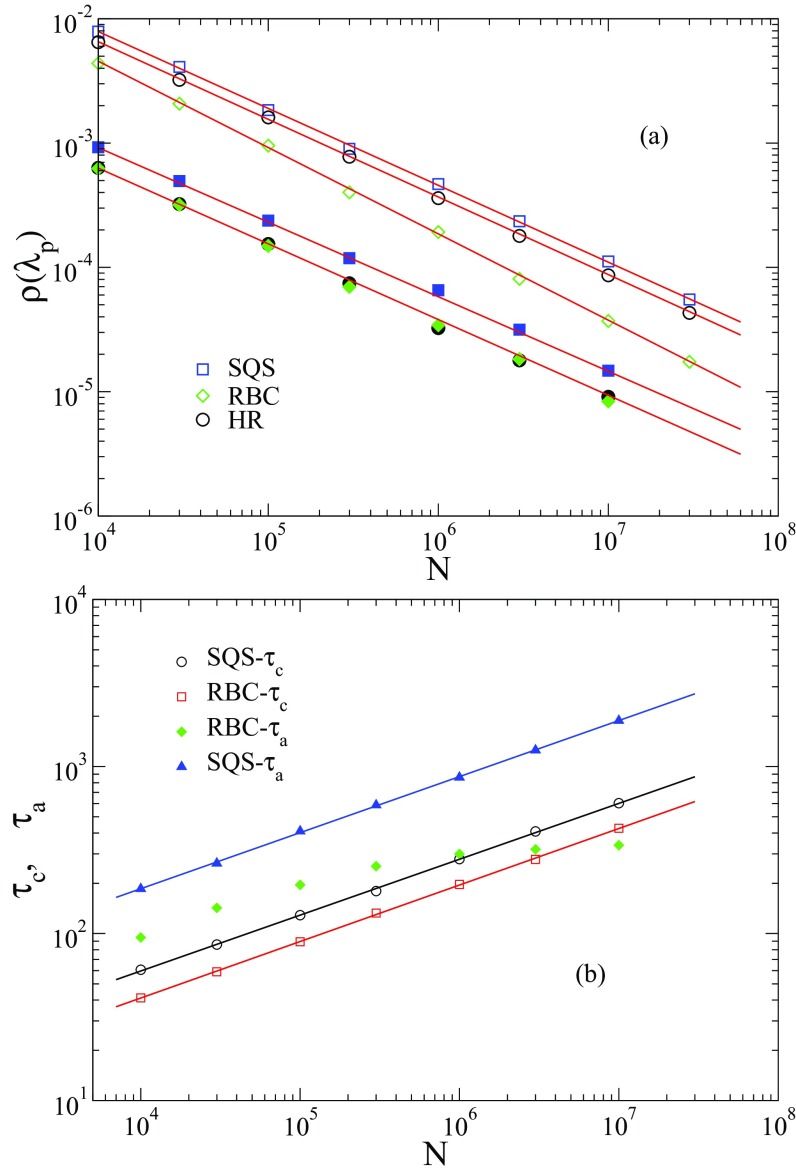
Figure 7(a) shows the FSS of the order parameter evaluated at the position of the susceptibility peak [31] for . Assuming a scaling , the FSS of CP provides for RBC, HR, and SQS methods. Here the numbers in parentheses represent uncertainties due to the regression. However, for the SIS model we found for RBC in contrast with and obtained for SQS and HR methods. Notice that the SQS exponents for SIS and CP are the same within uncertainties. The FSS of the autocorrelation time and epidemic lifespan for SIS model are shown in Fig. 7(b). As in the case of RRN networks, the time increases logarithmically for RBC and HR (data not shown for the latter) methods. On the other hand, the autocorrelation times provide the same scaling for RBC, HR, and SQS that agrees with the scaling of obtained via the SQS method. Assuming a scaling , we found the same exponent for in all methods and in SQS. Equivalent results were obtained for CP with an exponent .
FIG. 7.
Finite-size scaling of epidemic models on UCM networks with . (a) Critical density for SIS (open symbols) and CP (filled symbols). The densities for CP were divided by a factor 10 to improve the visibility. (b) FSS of the integrated correlation time () and time between attempts of visits to the absorbing state () for the SIS model. The SQS data for is divided by a factor to improve the visibility. The lines represent PL regressions. The averages were performed over 10 network realizations and the error bars are smaller than the symbols.
Let us shed some light on the difference between SIS simulations using RBC and HR methods. In RBC, the probability of returning to the absorbing configuration in the next step after the epidemic is restarted is , where is the degree of the vertex where the activity ended and returned subsequently. Since the pre-absorbing state will, with large probability, be in a vertex of low degree, which represents the great majority of vertices in the network, and remembering that as , the probability that the system falls back into the absorbing state in the next step goes to 1. In the HR method, the particle returns to a vertex of degree such that and the probability to produce an outbreak with infected vertices goes to 1. So this qualitatively explain why HR is similar to SQS rather than RBC since the long-term regime of SQS is constituted by a large number of configurations with , many of them neighboring the hubs and increasing the chance of their reactivation. Note that in the CP dynamics, the system returns to the absorbing state with probability irrespective of the vertex degree and a new outbreak with has a finite probability to happen in both RBC and HR. The autocorrelation is insensitive to this detail and provides the same FSS scaling exponents for all methods.
B.
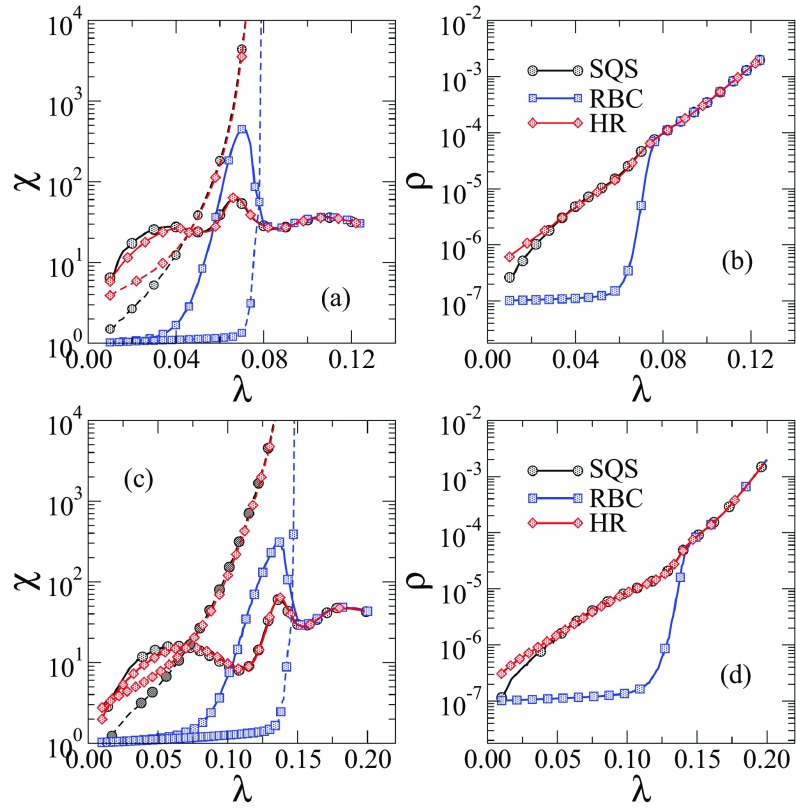
For the degree distribution of the UCM model has a finite variance but presents some vertices with degree much larger than the rest of the network, hereafter called outliers; see discussions in Refs. [18,36]. These outliers generate localized metastable patches that can be independently activated, manifested as multiple peaks in the susceptibility of the SIS model on large networks simulated with the SQS method [18,30,42,54]. Susceptibility curves comparing the different methods for the same network realization are shown in Fig. 8. A remarkable difference is that the peak observed at small in SQS curves, which is due to the activity localized in the most connected vertex of the network [18,42], is not observed in the RBC but is in the HR method. The secondary peaks are associated to the lifespan divergence [18]. The SQS and HR methods are equivalent. The activation of the most connected vertex is not captured by RBC method but it is for the other two methods. A smearing of the transition [36,59,60] in SQS and HR methods is more evident than in the case . As expected, above the epidemic threshold, the methods become equivalent since the absorbing state was never visited in the simulations. It is worth mentioning that the multiple transitions are not artifacts of the SQS simulations, and are also observed with the HR and RBC methods.
FIG. 8.
Susceptibility and QS density curves for the SIS model on UMC networks with (a), (b) and (c), (d) using different QS methods. The dashed lines are the epidemic lifespan . The network size is .
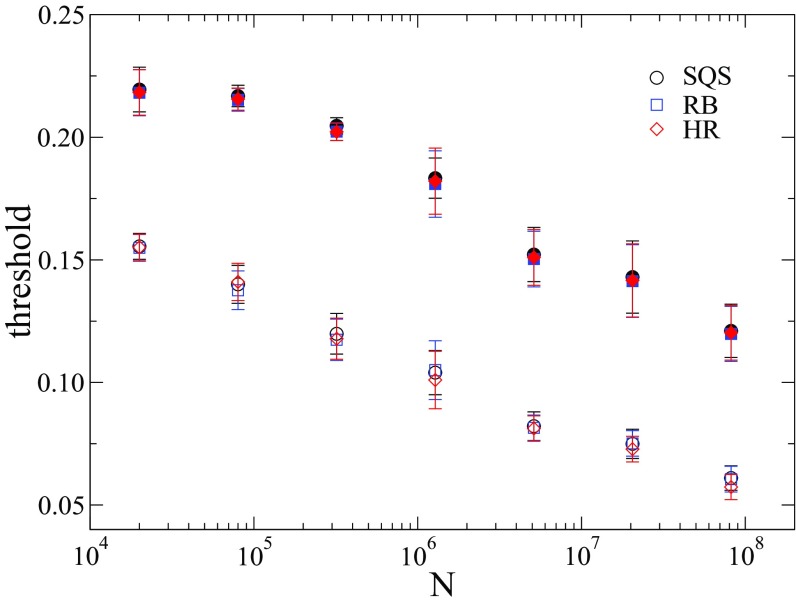
Figure 9 shows the scaling of the epidemic threshold of SIS model for and as a function of the network size. One can see that the size dependences are remarkably similar for the three methods and the differences are inside uncertainties.
FIG. 9.
Effective thresholds as a function of the system size for SIS model on UCM networks with (open symbols) and (filled symbols) using different QS methods.
C. Comparison between WEF and RBC methods
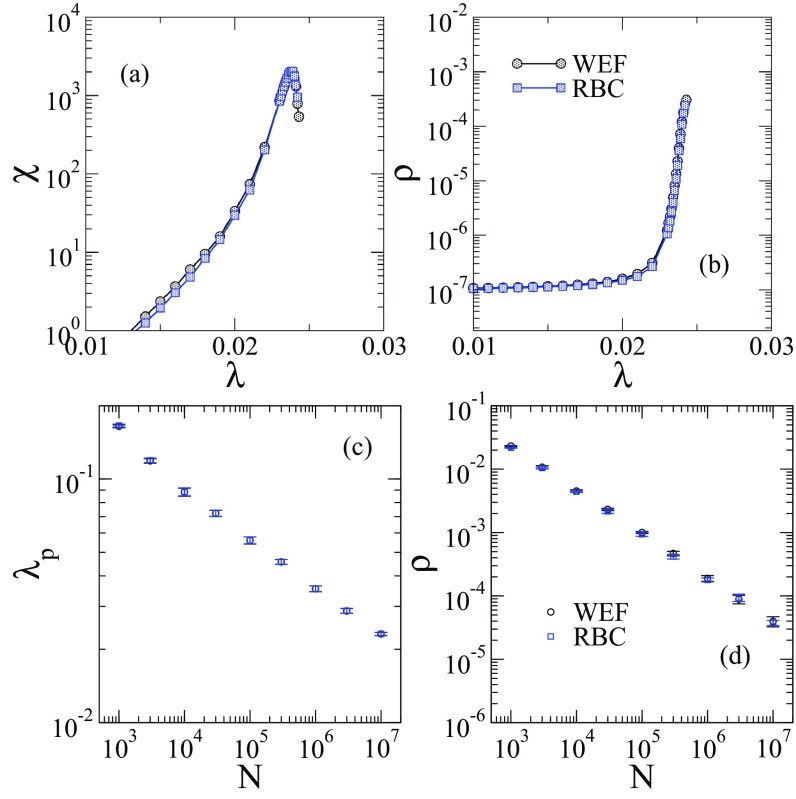
In the limit of the weak external field (WEF), the creation events rarely occur in the active phase and therefore it is equivalent to RBC method in regular graphs [40]. However, some differences are eligible in highly heterogeneous networks since pre-absorbing states are usually configurations with infection near or in a hub. This could enhance the chance of epidemic outbreak occurrence in RBC method because the epidemic would restart nearer a hub than in WEF method, where it returns to a randomly selected vertex. We performed simulations using an external field . A comparison of the methods for SIS in Fig. 10 shows the equivalence between them.
FIG. 10.
Equivalence of RBC and WEF methods for SIS model on UCM networks with degree exponent . Top panels show the (a) susceptibility and (b) density of infected vertices against infection rate. Bottom panels show the FSS of (c) epidemic threshold and (d) critical density.
VII. CONCLUSIONS
The interplay between structural properties of complex networks and evolution of epidemic processes on the top of them constitutes a fundamental problem in network science [11]. Distinct theories have been developed to address central questions such as the position or existence of epidemic thresholds [7–9,11,15,32,50,61], localization and delocalization of epidemic phases [17,19,20,35], and the critical exponents ruling the epidemics around the threshold [6,26,27,31]. In this framework, numerical simulations are fundamental tools in the validation of theories and conjectures [7,15,28,30,32,42] as well as in the setting up of new physical and analytical insights [8,9,60].
Simulations near the epidemic threshold constitute a challenge since in finite networks an absorbing state, in which the epidemic is eradicated, will always be reached due to the finite number of accessible configurations [4]. Aiming at investigating epidemic processes with steady states via stochastic simulations, one needs to resort to the QS approaches, which suitably handle the absorbing states, along with a finite-size analysis. In these approaches a perturbation of the original dynamics, which is negligible in the thermodynamical limit of the active phase, is introduced. We investigated distinct QS methods: The SQS has sampling constrained to active configurations; the RBC, where the dynamics returns to the configuration that it was immediately prior the visit to the absorbing state; the HR method, where the epidemic is restarted in one of the most connected vertices of the network; and a weak external field (WEF) that introduces spontaneous infection. Two distinct epidemic models with active steady state were considered, the CP [4] and the SIS [11] models, whose phase transitions have different natures [8].
We observed that all methods are equivalent for CP, providing the same epidemic thresholds and FSS exponents of the critical QS quantities. For SIS, the same thresholds are obtained for all methods but the FSS of the critical density provides scaling exponents for RBC and WEF different from SQS and HR methods. Also, RBC and WEF do not capture epidemic activity localized in the most connected vertex of the network. So, if one wishes an analysis rid of localized epidemics, RBC method is indicated but if one also needs to resolve localization the SQS or HR are more appropriated. The SQS is theoretically well grounded [46,48,53] but it is algorithmically more complicated and computationally less efficient than the other investigated methods.
An advantage of the SQS method is that it provides an epidemic lifespan proportional to the characteristic relaxation time in both subcritical and critical regimes [41], but it is infinite in the active phase. Moreover, for the other investigated methods the epidemic lifespan does not correspond to the characteristic relaxation time. In order to overcome these difficulties we analyzed the autocorrelation time of the QS series for the different methods. Autocorrelation provides the characteristic relaxation time, including in the supercritical regime. We found the same FSS exponents for all investigated methods irrespective of the network and epidemic models considered. In particular, applying the autocorrelation method to regular lattices of dimension and 3 as well as RRN (), the directed percolation exponents were obtained.
ACKNOWLEDGMENTS
This work was partially supported by the Brazilian agencies CNPq, FAPEMIG, and CAPES. S.C.F. thanks Romualdo Pastor-Satorras for discussions during visits to UFV supported by the program Ciência sem Fronteiras - CAPES (Grant No. 88881.030375/2013-01).
Footnotes
There exist other important methods to deal with absorbing states in finite-size systems, e.g., those conserving the number of particles [38].
For the modified dynamics it is not necessarily a master equation since nonlinear terms are allowed.
It is more convenient to consider the number of sites rather than the system length since we aim at networks.
In the Gillespie algorithm, the time increments are drawn from an exponential distribution with average . For long QS averaging, the results are independent of this step.
In regular graphs where all vertices have the same number of connections the SIS and CP thresholds are related by . Using the thresholds known for CP in hypercubic lattices [1] we have , 0.41219, and 0.21948 for , 2, and 3, respectively.
REFERENCES
- [1].M. Henkel, H. Hinrichsen, and S. Lübeck, Non-equilibrium Phase Transition: Absorbing Phase Transitions (Springer Verlag, Netherlands, 2008). [Google Scholar]
- [2].H. Hinrichsen, Non-equilibrium critical phenomena and phase transitions into absorbing states, Adv. Phys. 49, 815 (2000). 10.1080/00018730050198152 [DOI] [Google Scholar]
- [3].G. Ódor, Universality classes in nonequilibrium lattice systems, Rev. Mod. Phys. 76, 663 (2004). 10.1103/RevModPhys.76.663 [DOI] [Google Scholar]
- [4].J. Marro and R. Dickman, Nonequilibrium Phase Transitions in Lattice Models (Cambridge University Press, Cambridge, UK, 1999). [Google Scholar]
- [5].T. E. Harris, Contact interactions on a lattice, Ann. Prob. 2, 969 (1974). 10.1214/aop/1176996493 [DOI] [Google Scholar]
- [6].C. Castellano and R. Pastor-Satorras, Non-Mean-Field Behavior of the Contact Process on Scale-Free Networks, Phys. Rev. Lett. 96, 038701 (2006). 10.1103/PhysRevLett.96.038701 [DOI] [PubMed] [Google Scholar]
- [7].R. Pastor-Satorras and A. Vespignani, Epidemic Spreading in Scale-Free Networks, Phys. Rev. Lett. 86, 3200 (2001). 10.1103/PhysRevLett.86.3200 [DOI] [PubMed] [Google Scholar]
- [8].S. C. Ferreira, R. S. Sander, and R. Pastor-Satorras, Collective versus hub activation of epidemic phases on networks, Phys. Rev. E 93, 032314 (2016). 10.1103/PhysRevE.93.032314 [DOI] [PMC free article] [PubMed] [Google Scholar]
- [9].M. Boguñá, C. Castellano, and R. Pastor-Satorras, Nature of the Epidemic Threshold for the Susceptible-Infected-Susceptible Dynamics in Networks, Phys. Rev. Lett. 111, 068701 (2013). 10.1103/PhysRevLett.111.068701 [DOI] [PubMed] [Google Scholar]
- [10].S. N. Dorogovtsev, A. V. Goltsev, and J. F. F. Mendes, Critical phenomena in complex networks, Rev. Mod. Phys. 80, 1275 (2008). 10.1103/RevModPhys.80.1275 [DOI] [Google Scholar]
- [11].R. Pastor-Satorras, C. Castellano, P. Van Mieghem, and A. Vespignani, Epidemic processes in complex networks, Rev. Mod. Phys. 87, 925 (2015). 10.1103/RevModPhys.87.925 [DOI] [Google Scholar]
- [12].R. Pastor-Satorras and A. Vespignani, Epidemic dynamics and endemic states in complex networks, Phys. Rev. E 63, 066117 (2001). 10.1103/PhysRevE.63.066117 [DOI] [PubMed] [Google Scholar]
- [13].R. M. May and A. L. Lloyd, Infection dynamics on scale-free networks, Phys. Rev. E 64, 066112 (2001). 10.1103/PhysRevE.64.066112 [DOI] [PubMed] [Google Scholar]
- [14].M. E. J. Newman, Spread of epidemic disease on networks, Phys. Rev. E 66, 016128 (2002). 10.1103/PhysRevE.66.016128 [DOI] [PubMed] [Google Scholar]
- [15].C. Castellano and R. Pastor-Satorras, Thresholds for Epidemic Spreading in Networks, Phys. Rev. Lett. 105, 218701 (2010). 10.1103/PhysRevLett.105.218701 [DOI] [PubMed] [Google Scholar]
- [16].S. Chatterjee and R. Durrett, Contact processes on random graphs with power law degree distributions have critical value 0, Ann. Probab. 37, 2332 (2009). 10.1214/09-AOP471 [DOI] [Google Scholar]
- [17].H. K. Lee, P.-S. Shim, and J. D. Noh, Epidemic threshold of the susceptible-infected-susceptible model on complex networks, Phys. Rev. E 87, 062812 (2013). 10.1103/PhysRevE.87.062812 [DOI] [PubMed] [Google Scholar]
- [18].A. S. Mata and S. C. Ferreira, Multiple transitions of the susceptible-infected-susceptible epidemic model on complex networks, Phys. Rev. E 91, 012816 (2015). 10.1103/PhysRevE.91.012816 [DOI] [PubMed] [Google Scholar]
- [19].A. V. Goltsev, S. N. Dorogovtsev, J. G. Oliveira, and J. F. F. Mendes, Localization and Spreading of Diseases in Complex Networks, Phys. Rev. Lett. 109, 128702 (2012). 10.1103/PhysRevLett.109.128702 [DOI] [PubMed] [Google Scholar]
- [20].G. Ódor, Spectral analysis and slow spreading dynamics on complex networks, Phys. Rev. E 88, 032109 (2013). 10.1103/PhysRevE.88.032109 [DOI] [PubMed] [Google Scholar]
- [21].K.-I. Goh, D.-S. Lee, B. Kahng, and D. Kim, Sandpile on Scale-Free Networks, Phys. Rev. Lett. 91, 148701 (2003). 10.1103/PhysRevLett.91.148701 [DOI] [PubMed] [Google Scholar]
- [22].J.-D. Bancal and R. Pastor-Satorras, Steady-state dynamics of the forest fire model on complex networks, Eur. Phys. J. B 76, 109 (2010). 10.1140/epjb/e2010-00165-7 [DOI] [Google Scholar]
- [23].D.-S. Lee, K.-I. Goh, B. Kahng, and D. Kim, Sandpile avalanche dynamics on scale-free networks, Physica A (Amsterdam, Neth.) 338, 84 (2004). 10.1016/j.physa.2004.02.028 [DOI] [Google Scholar]
- [24].H. Da-Yin and W. Lie-Yan, Phase transition of the pair contact process model in a fragmented network, Chin. Phys. Lett. 27, 098901 (2010). 10.1088/0256-307X/27/9/098901 [DOI] [Google Scholar]
- [25].R. S. Sander, S. C. Ferreira, and R. Pastor-Satorras, Phase transitions with infinitely many absorbing states in complex networks, Phys. Rev. E 87, 022820 (2013). 10.1103/PhysRevE.87.022820 [DOI] [PubMed] [Google Scholar]
- [26].H. Hong, M. Ha, and H. Park, Finite-Size Scaling in Complex Networks, Phys. Rev. Lett. 98, 258701 (2007). 10.1103/PhysRevLett.98.258701 [DOI] [PubMed] [Google Scholar]
- [27].C. Castellano and R. Pastor-Satorras, Routes to Thermodynamic Limit on Scale-Free Networks, Phys. Rev. Lett. 100, 148701 (2008). 10.1103/PhysRevLett.100.148701 [DOI] [PubMed] [Google Scholar]
- [28].S. C. Ferreira, R. S. Ferreira, C. Castellano, and R. Pastor-Satorras, Quasi-stationary simulations of the contact process on quenched networks, Phys. Rev. E 84, 066102 (2011). 10.1103/PhysRevE.84.066102 [DOI] [PubMed] [Google Scholar]
- [29].M. Newman, Networks: An Introduction (Oxford University Press, New York, 2010). [Google Scholar]
- [30].A. S. Mata and S. C. Ferreira, Pair quenched mean-field theory for the susceptible-infected-susceptible model on complex networks, Europhys. Lett. 103, 48003 (2013). 10.1209/0295-5075/103/48003 [DOI] [Google Scholar]
- [31].A. S. Mata, R. S. Ferreira, and S. C. Ferreira, Heterogeneous pair-approximation for the contact process on complex networks, New J. Phys. 16, 053006 (2014). 10.1088/1367-2630/16/5/053006 [DOI] [Google Scholar]
- [32].J. P. Gleeson, Binary-State Dynamics on Complex Networks: Pair Approximation and Beyond, Phys. Rev. X 3, 021004 (2013). 10.1103/PhysRevX.3.021004 [DOI] [Google Scholar]
- [33].C. Buono, F. Vazquez, P. A. Macri, and L. A. Braunstein, Slow epidemic extinction in populations with heterogeneous infection rates, Phys. Rev. E 88, 022813 (2013). 10.1103/PhysRevE.88.022813 [DOI] [PubMed] [Google Scholar]
- [34].G. Ódor, Localization transition, Lifschitz tails, and rare-region effects in network models, Phys. Rev. E 90, 032110 (2014). 10.1103/PhysRevE.90.032110 [DOI] [PubMed] [Google Scholar]
- [35].M. A. Muñoz, R. Juhász, C. Castellano, and G. Ódor, Griffiths Phases on Complex Networks, Phys. Rev. Lett. 105, 128701 (2010). 10.1103/PhysRevLett.105.128701 [DOI] [PubMed] [Google Scholar]
- [36].W. Cota, S. C. Ferreira, and G. Ódor, Griffiths effects of the susceptible-infected-susceptible epidemic model on random power-law networks, Phys. Rev. E 93, 032322 (2016). 10.1103/PhysRevE.93.032322 [DOI] [PubMed] [Google Scholar]
- [37].R. Dickman, T. Tomé, and M. J. de Oliveira, Sandpiles with height restrictions, Phys. Rev. E 66, 016111 (2002). 10.1103/PhysRevE.66.016111 [DOI] [PubMed] [Google Scholar]
- [38].T. Tomé and M. J. de Oliveira, Nonequilibrium Model for the Contact Process in an Ensemble of Constant Particle Number, Phys. Rev. Lett. 86, 5643 (2001). 10.1103/PhysRevLett.86.5643 [DOI] [PubMed] [Google Scholar]
- [39].S. Lübeck and P. C. Heger, Universal finite-size scaling behavior and universal dynamical scaling behavior of absorbing phase transitions with a conserved field, Phys. Rev. E 68, 056102 (2003). 10.1103/PhysRevE.68.056102 [DOI] [PubMed] [Google Scholar]
- [40].G. Pruessner, Equivalence of conditional and external field ensembles in absorbing-state phase transitions, Phys. Rev. E 76, 061103 (2007). 10.1103/PhysRevE.76.061103 [DOI] [PubMed] [Google Scholar]
- [41].M. M. de Oliveira and R. Dickman, How to simulate the quasistationary state, Phys. Rev. E 71, 016129 (2005). 10.1103/PhysRevE.71.016129 [DOI] [PubMed] [Google Scholar]
- [42].S. C. Ferreira, C. Castellano, and R. Pastor-Satorras, Epidemic thresholds of the susceptible-infected-susceptible model on networks: A comparison of numerical and theoretical results, Phys. Rev. E 86, 041125 (2012). 10.1103/PhysRevE.86.041125 [DOI] [PubMed] [Google Scholar]
- [43].P. Van Mieghem and E. Cator, Epidemics in networks with nodal self-infection and the epidemic threshold, Phys. Rev. E 86, 016116 (2012). 10.1103/PhysRevE.86.016116 [DOI] [PubMed] [Google Scholar]
- [44].A. Barrat, M. Barthélemy, and A. Vespignani, Dynamical Processes on Complex Networks (Cambridge University Press, Cambridge, UK, 2008). [Google Scholar]
- [45].N. G. van Kampen, Stochastic Processes in Chemistry and Physics (Elsevier, Amsterdam, the Netherlands, 2007). [Google Scholar]
- [46].J. Blanchet, P. Glynn, and S. Zheng, Theoretical analysis of a stochastic approximation approach for computing quasi-stationary distributions, arXiv:1401.0364.
- [47].S. Lübeck and H.-K. Janssen, Finite-size scaling of directed percolation above the upper critical dimension, Phys. Rev. E 72, 016119 (2005). 10.1103/PhysRevE.72.016119 [DOI] [PubMed] [Google Scholar]
- [48].R. Dickman and R. Vidigal, Quasi-stationary distributions for stochastic processes with an absorbing state, J. Phys. A 35, 1147 (2002). 10.1088/0305-4470/35/5/303 [DOI] [Google Scholar]
- [49].Y. Wang, D. Chakrabarti, C. Wang, and C. Faloutsos, Epidemic spreading in real networks: An eigenvalue viewpoint, in Twenty-second International Symposium on Reliable Distributed Systems (SRDS '03) (IEEE Computer Society, Los Alamitos, CA, 2003), pp. 25–34. [Google Scholar]
- [50].P. Van Mieghem, The -intertwined SIS epidemic network model, Computing 93, 147 (2011). 10.1007/s00607-011-0155-y [DOI] [Google Scholar]
- [51].M. Boguñá, C. Castellano, and R. Pastor-Satorras, Langevin approach for the dynamics of the contact process on annealed scale-free networks, Phys. Rev. E 79, 036110 (2009). 10.1103/PhysRevE.79.036110 [DOI] [PubMed] [Google Scholar]
- [52].J. D. Noh and H. Park, Critical behavior of the contact process in annealed scale-free networks, Phys. Rev. E 79, 056115 (2009). 10.1103/PhysRevE.79.056115 [DOI] [PubMed] [Google Scholar]
- [53].S. C. Ferreira, R. S. Ferreira, and R. Pastor-Satorras, Quasi-stationary analysis of the contact process on annealed scale-free networks, Phys. Rev. E 83, 066113 (2011). 10.1103/PhysRevE.83.066113 [DOI] [PubMed] [Google Scholar]
- [54].G. F. de Arruda, E. Cozzo, T. P. Peixoto, F. A. Rodrigues, and Y. Moreno, Epidemic spreading in interconnected networks: A continuous time approach, arXiv:1509.07054.
- [55].P. Shu, W. Wang, M. Tang, and Y. Do, Numerical identification of epidemic thresholds for susceptible-infected-recovered model on finite-size networks, Chaos 25, 063104 (2015). 10.1063/1.4922153 [DOI] [PMC free article] [PubMed] [Google Scholar]
- [56].R. S. Ferreira and S. C. Ferreira, Critical behavior of the contact process on small-world networks, Eur. Phys. J. B 86, 462 (2013). 10.1140/epjb/e2013-40534-0 [DOI] [Google Scholar]
- [57].M. Catanzaro, M. Boguñá, and R. Pastor-Satorras, Generation of uncorrelated random scale-free networks, Phys. Rev. E 71, 027103 (2005). 10.1103/PhysRevE.71.027103 [DOI] [PubMed] [Google Scholar]
- [58].W. H. Press, S. A. Teukolsky, W. T. Vetterling, and B. P. Flannery, Numerical Recipes: The Art of Scientific Computing, 3rd ed. (Cambridge University Press, New York, NY, 2007). [Google Scholar]
- [59].T. Vojta, Rare region effects at classical, quantum, and nonequilibrium phase transitions, J. Phys. A 39, R143 (2006). 10.1088/0305-4470/39/22/R01 [DOI] [Google Scholar]
- [60].G. Ódor and R. Pastor-Satorras, Slow dynamics and rare-region effects in the contact process on weighted tree networks, Phys. Rev. E 86, 026117 (2012). 10.1103/PhysRevE.86.026117 [DOI] [PubMed] [Google Scholar]
- [61].A. Ganesh, L. Massoulié, and D. Towsley, The effect of network topology on the spread of epidemics, in Proceedings IEEE 24th Annual Joint Conference of the IEEE Computer and Communications Societies (IEEE, 2005), pp. 1455–1466. [Google Scholar]


