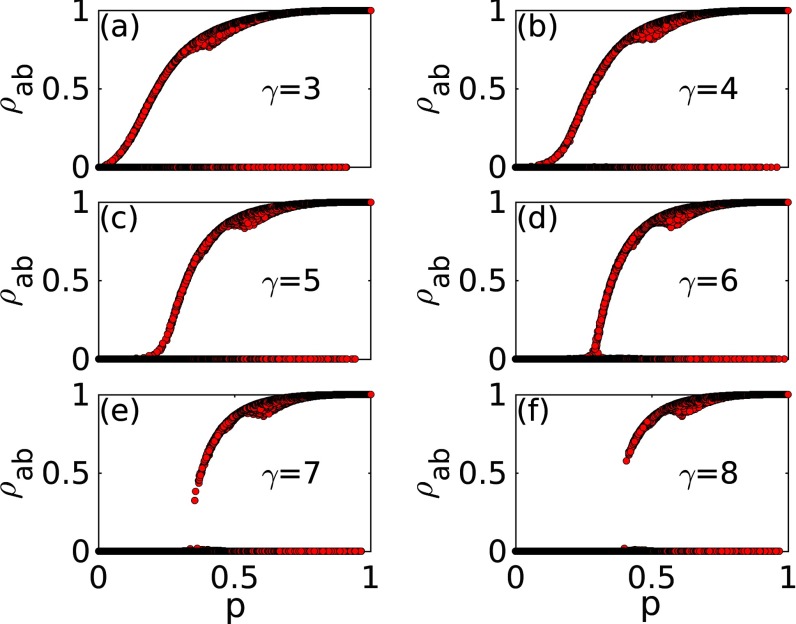
FIG. 1.
The six panels represent the total density of population recovered from both A and B in the final state plotted versus on power-law networks with , built by applying the uncorrelated configuration model. The system size is , and . The results are averaged over a number of independent realizations, that is, 200 for to 5, and is increased to 2000 for to 8.

