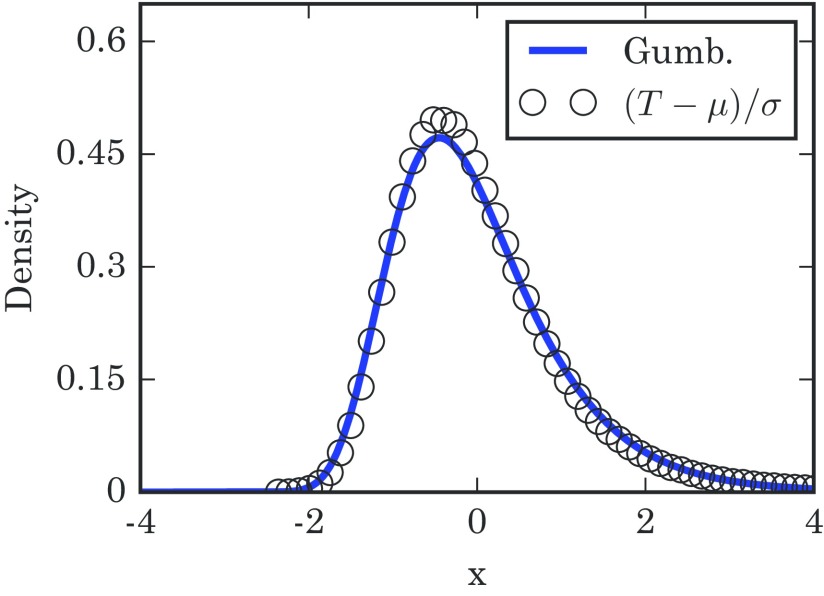
FIG. 11.
Distribution of takeover times for a Barabasi-Albert scale-free network with a minimum degree of 3 and nodes. Simulation results were compiled from runs, all using the same realization of the random graph and all with the initial infection starting at the same node. The solid line is the distribution for reference. and are the numerically calculated mean and variance of .

