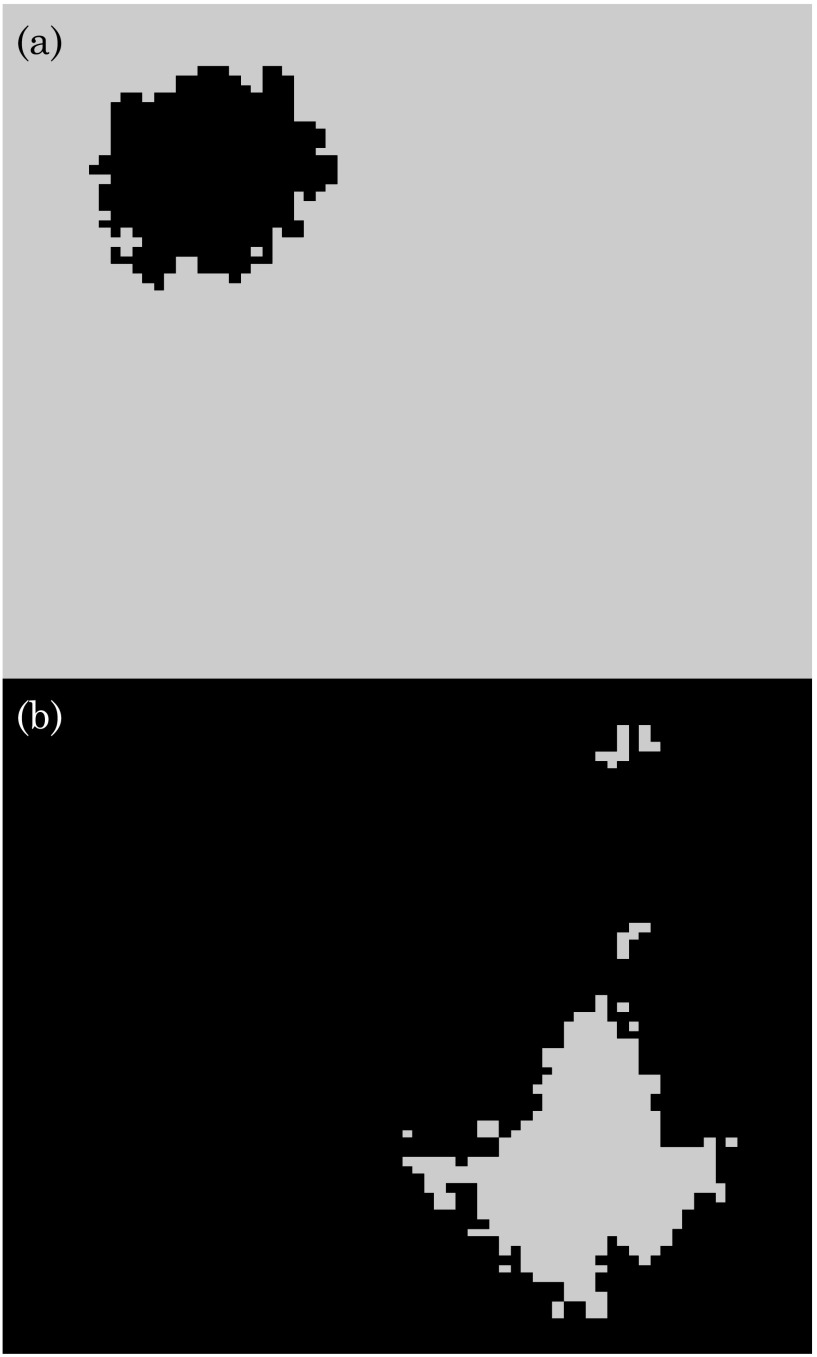
FIG. 5.
Snapshots of our infection dynamics on a two-dimensional (2D) periodic cubic lattice. Black pixels show infected nodes, and grey pixels show susceptible nodes. (a) Snapshot near the beginning of the dynamics and (b) snapshot near the end. Notice how the blob of infected nodes in the top panel has a fairly simple shape, and most of the susceptible nodes lie in a single cluster in the bottom panel.

