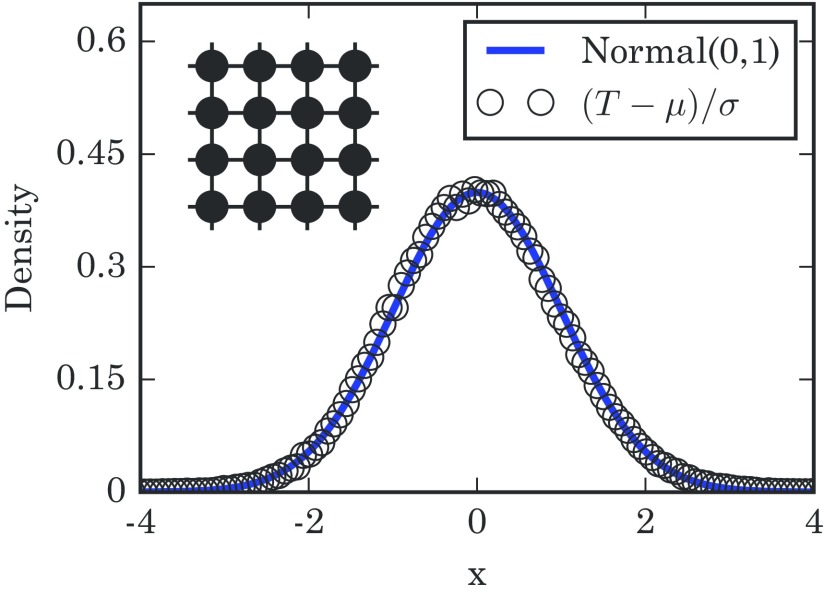
FIG. 7.
Distribution of takeover times for a 2D lattice with a side length of . The numerical results are obtained from simulations. The solid line is the standard normal distribution. The empirical quantities and are the numerically calculated mean and variance of . The schematic diagram in the upper left shows a 2D lattice.

