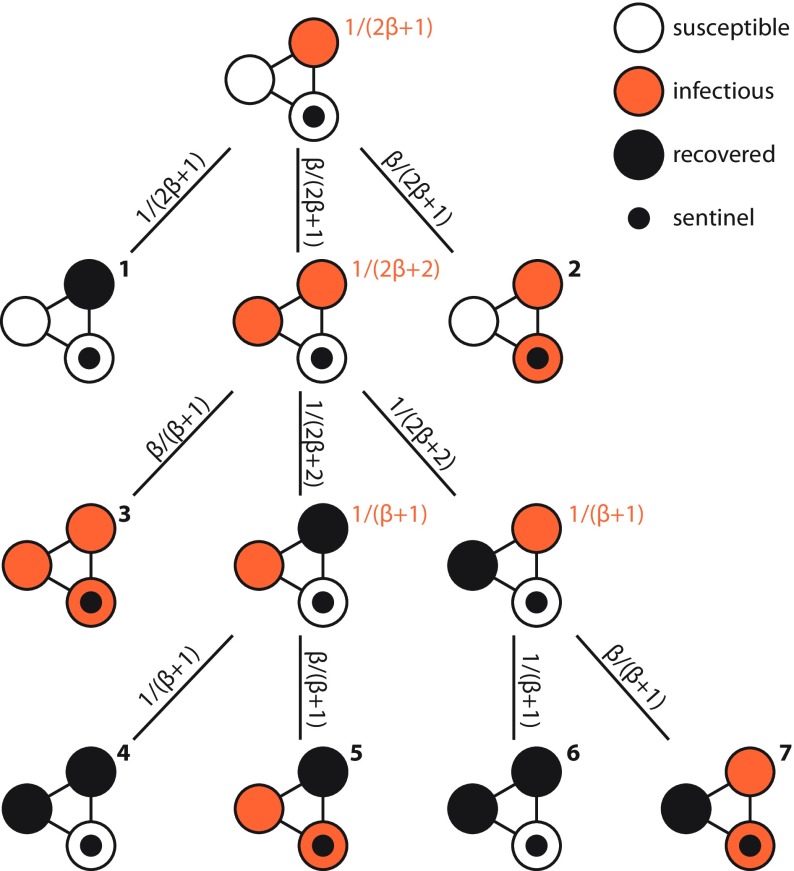
FIG. 2.
Illustration of how to calculate the expected time to discovery or extinction in a small network with one sentinel. The probabilities of transitions are marked on the links (with black text). The expected time to stay in a configuration is next to the configurations (in orange). The final states (where there are either no infectious nodes or a sentinel is infected) are enumerated by boldface numbers.

