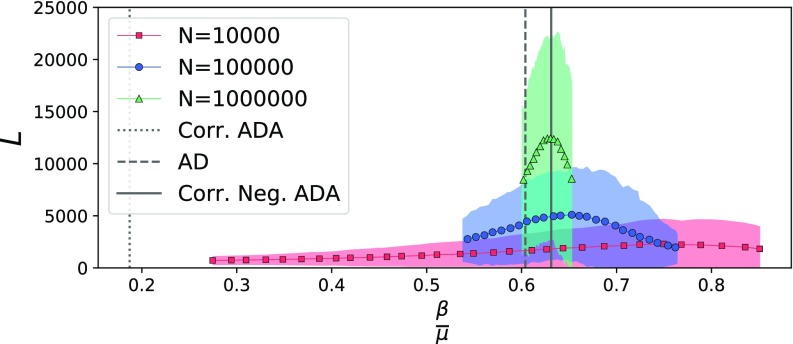
FIG. 7.
Lifetime of an SIS process on an ADA network with negative deterministic activity-attractiveness correlation of the type , plotted for different values of and different network sizes; we used a power-law distributed activity with exponent and let vary while keeping fixed and . We set , and run the following: for simulations (red); for simulations (blue); for simulations (green). Solid lines with markers and shaded areas represent the mean and confidence interval separately. The results match the theoretical prediction for the epidemic threshold (solid line). The comparison with the case of identical correlation shows how the two scenarios produce contrasting effects, with a negative correlation hindering the spreading phenomenon.

