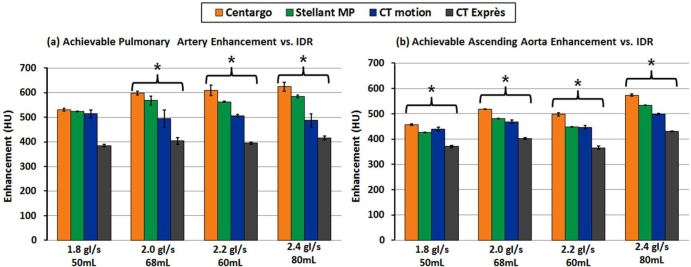
Figure 3.
Achievable vascular enhancement vs injection system with varied IDRs through a 22G catheter: The left graph (a) provides peak enhancement results from all injection systems in the pulmonary artery, while the right graph (b) was acquired from the ascending aorta. Error bars represent standard deviation across the three trials performed for each programmed injection. * denotes statistical difference between injection systems (p < 0.05).

