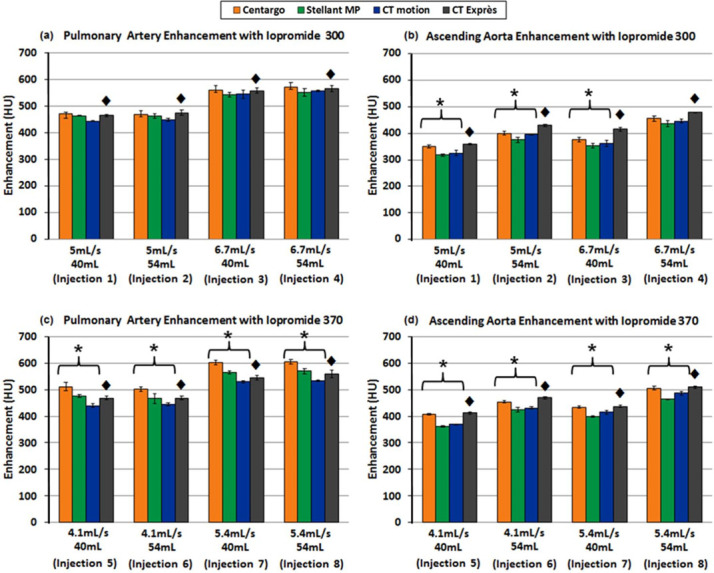
Figure 4.

Achievable vascular enhancement vs injection system with varied IDRs through a 20G catheter: the top two graphs (a, b) provide results using iopromide 300, while the bottom graphs (c, d) utilized iopromide 370. In addition, (a, c) are measurements from the pulmonary artery while (b, d) are measurements from the ascending aorta. Error bars represent standard deviation across the three trials performed for each programmed injection. ♦ denotes data obtained using the CT Exprès injection system where iodine was over delivered. Due to the additional contrast media, comparisons with CT Exprès were not considered, though the data are provided for completeness. * denotes statistical difference between injection systems (p < 0.05).
